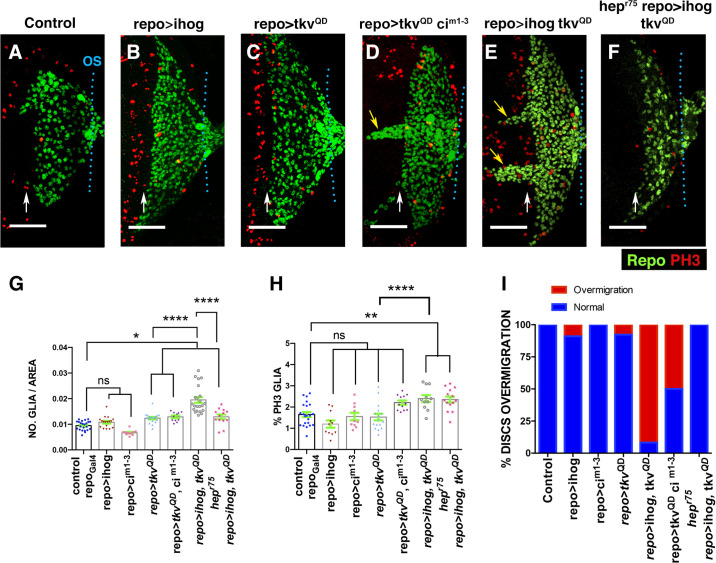
Fig 9. Overexpression of ihog and tkvQD in glial cells induces over-migration and proliferation.
(A–F) Third instar eye discs stained with anti-PH3 (red) and anti-Repo (green). Basal layers of the eye disc epithelium. (A) Control tub-Gal80ts repo-Gal4 eye disc. (B)tub-Gal80ts/UAS-ihog; repo-Gal4/+. (C) tub-Gal80ts/+; repo-Gal4/UAS-tkvQD. (D) tub-Gal80ts/UAS-tkvQD/UAS-cim1-3; repo-Gal4/UAStkvQD. (E) tubGal80ts/UAS-ihog;repo-Gal4/UAS-tkvQD. (F) hepr75; tub-Gal80ts/UAS-ihog; repo-Gal4/UAS-tkvQD. The overexpression of tkvQD under the control of repo-Gal4 increases the number of glial cells (C). The co-overexpression of UAS-tkvQD and UAS-ihog under repo-Gal4 increases the density and proliferation of subretinal glial cells and promotes the over-migration of these cells (E). The over-migration phenotype and the increase of glial density caused by the overexpression of UAS-tkvQD and UAS-ihog with repo-Gal4 was suppressed in the hepr75 mutant discs. Nonetheless, the glial cell division was not significantly altered (F and H). (G) The graph represents the glial density of discs shown in A-F. (H) Histogram showing the percentage of glial cells in mitosis (Ph3 positive) of discs indicated in A–F. (I) The graph represents the percentage of discs with glial over-migration shown in A–F. Scale bars, 50 μm. Statistical analysis is shown in Table H in S1 Text. The numerical data used in this figure are included in S1 Data.

