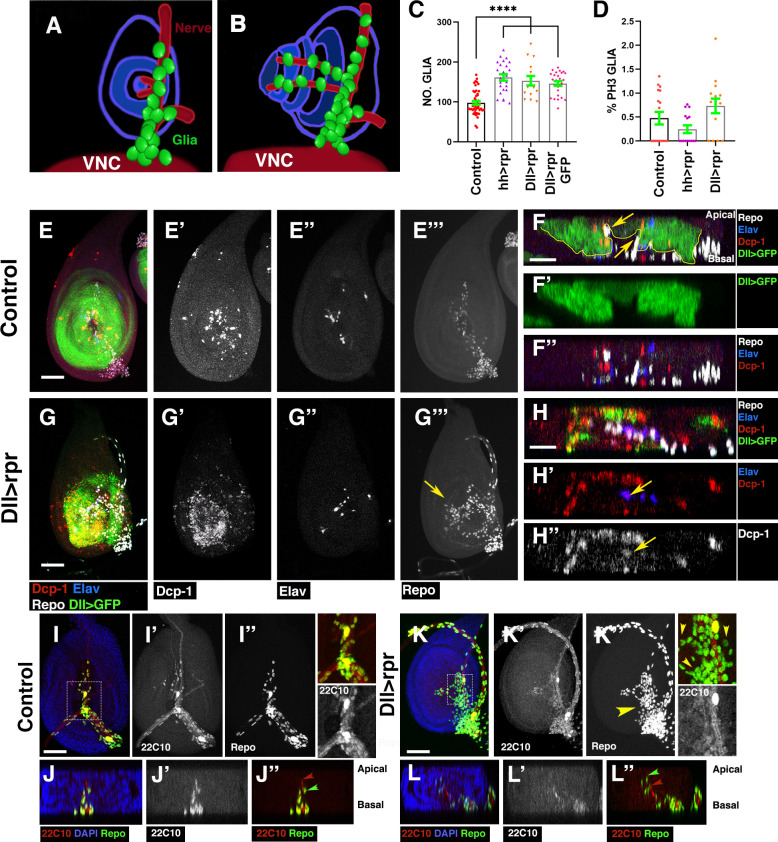
Fig 11. The induction of cell death in the leg disc causes glial cells accumulation in the leg disc epithelium.
(A and B) Schematic illustrations of leg discs, frontal view (A) and lateral view (B). Leg discs are concentrically organised, and they are connected to the VNC through the leg nerve. In third instar larvae, the glial cells in the leg discs (in green) are accumulated along the leg nerve (in red) and along 2 nerves into the telescoping leg. (C) The graph indicates the total number of glial cells in control and leg discs after cell death induction using Dll-Gal4 and hh-Gal4 lines. (H) Histogram showing the percentage of glial cells in mitosis (PH3 positive) in leg discs analysed in C. (E–E”” and G–G””) Projections of confocal image stacks of control Dll-Gal4 tub-Gal80ts/UAS-mCD8-GFP (E–E”’), and UAS-rpr; Dll-Gal4 tub-Gal80ts / UAS-mCD8-GFP (G–G””) leg discs after inducing cell death. (F–F” and H–H”) X–Z projections show a cross section of the leg discs epithelium shown in E (F–F”) and G (H–H”). The discs were stained for anti-Repo (white in E, E”’, F, F”, G, G”’, and H) anti-Dcp1 (red in E, F, F”, G, H, and H’ and grey in E’, G’, and H”), anti-Elav (blue in E, F, F”, G, H, and H’ and grey in E” and G”), and Dll>CD8GFP (green in E, F, F’, G, and H). Dll-Gal4 is not expressed in glial cells, since these cells do not express GFP under the control Dll-Gal4 (yellow arrows in F). The overexpression of UAS-rpr under the control of Dll-Gal4 tub-Gal80ts induces cell death throughout the leg discs epithelium, including some of the neurons forming part of the sense organs contained in this structure (yellow arrows in H’ and H”). (I–I” and K–K”) Projections of confocal image stacks of control Dll-Gal4 tub-Gal80ts (I–I”) and UAS-rpr; Dll-Gal4 tub-Gal80ts (K–K”) leg discs after inducing cell death. (J–J” and L–L”) Cross section of the leg discs shown in I (J–J”) and K (L–L”). The leg discs were stained for anti-Repo (green in I, J, J”, K, L, and L” and grey in I” and K”), DAPI (blue in I, J, K, and L), and anti-22C10 (red in I, J, J”, K, L, and L” and grey in I’, J’, K, and L’). Higher magnification images corresponding to the regions highlighted by white rectangles on the panels K and I are shown on the right panels. Note that whereas in control leg discs glial cells are located close to the nerve branches of the leg discs, upon apoptosis induction, glial cells detached from the nerve and spread throughout the leg disc (yellow arrowhead in K and yellow arrowheads in the high magnification’), compared undamaged discs (I–J”) with damaged discs (K and L”). Compare also the position of glial cells (green arrowhead in J” and L”) with respect to the nerve (red arrowhead in J” and L”) in control discs and damaged discs. In control discs, glial cells are located along the nerves into the telescoping leg (J”); however; upon cell death induction, some glial are detached from the nerve and appear distally to this (L”). Scale bars, 50 μm. Statistical analysis is shown in Table J in S1 Text. The numerical data used in this figure are included in S1 Data. rpr, reaper; VNC, ventral nerve cord.

