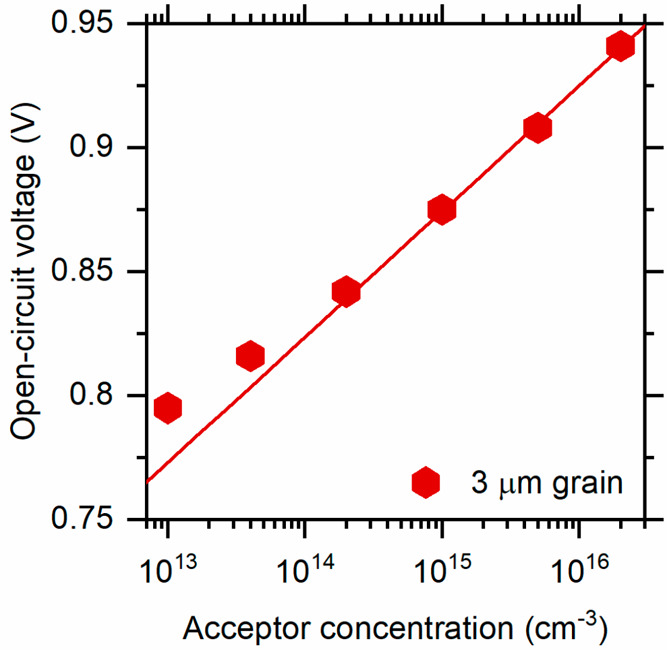
Figure 6.

Dependence of the open-circuit voltage VOC (solar illumination) on the CdTe acceptor concentration NA. Symbols are numerical results obtained with an electron carrier mobility μe = 100 cm2/(V s) and 3 μm grain widths; the solid line is a least-squares fit to the three highest values and yields a slope of +50 mV/decade. The material model predicts a slope of +58 mV/decade at 300 K.
