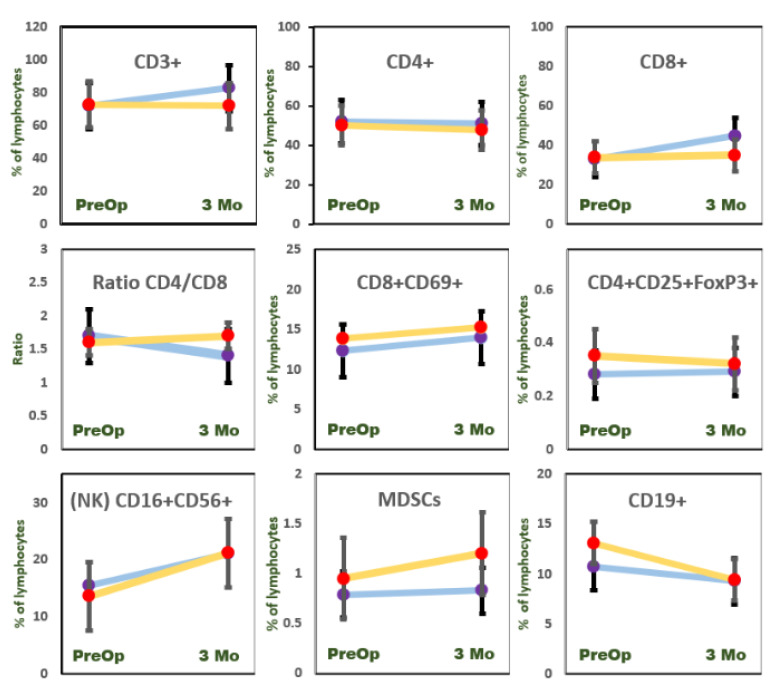
Figure 3.
Prostatectomy-induced percentage change of immunocyte populations. Low-risk (blue line) and high-risk (yellow line) patients were tested before surgical intervention (PreOp) and three months after (3 Mo). Bars represent standard error of mean value. All values are calculated as a percent of total lymphocytes, with the exception of CD4/CD8 ratio.

