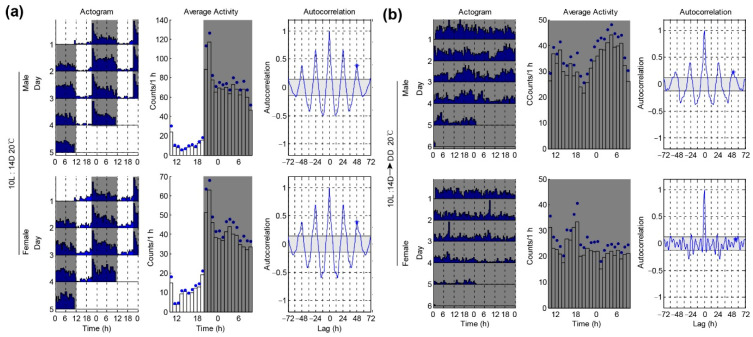
Figure 4.
P. xylostella males show better rhythm than females under a winter-like short day at 20 °C. (a) Locomotor rhythm of P. xylostella under 10L:14D and 20 °C conditions. Double-plotted actograms show the locomotor activity patterns of the different days (left panel). Each row contains two consecutive days of locomotor activities (counts per 30 min), and the last day is repeated to ensure that the next day is always the beginning of the next row. The x-axis shows the time of day under LD conditions. Mean activity plots are used to show the activity patterns (middle panel). The blue dots on the plots are SEM. The gray shadings in the plots denote light-off conditions. Autocorrelation plots are used to determine the rhythm index (RI) (right panel). (b) Locomotor activity rhythms of P. xylostella under the changing condition from 10L:14D condition to DD at 20 °C.

