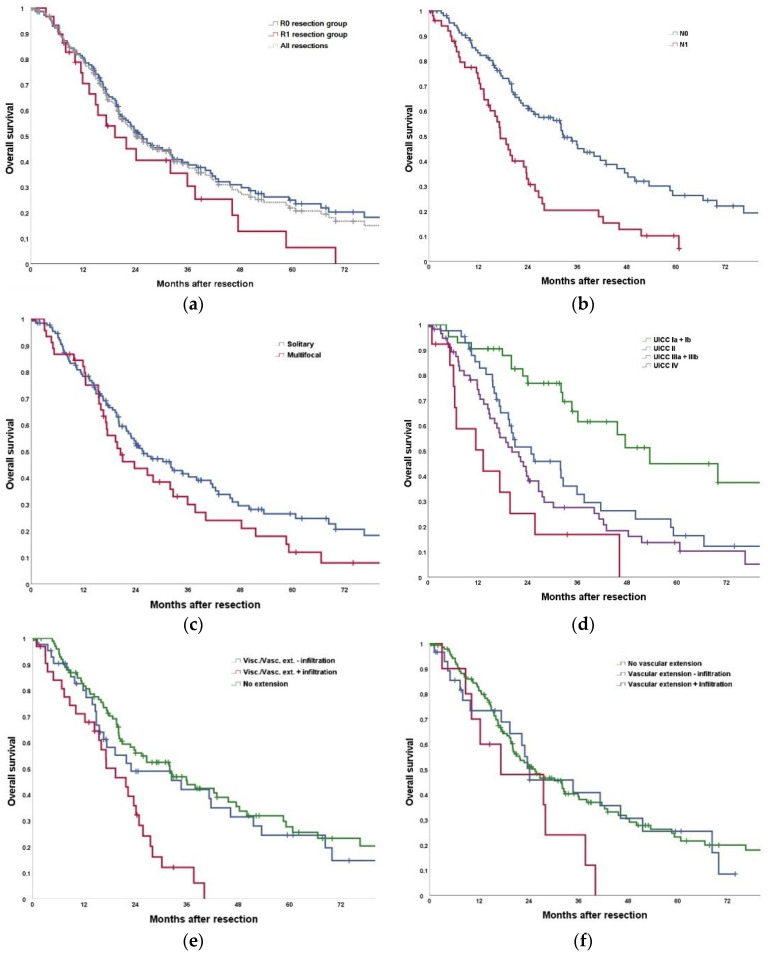
Figure 3.
(a) Comparison of overall survival of patients with R0 versus R1 resection; p = 0.092. Additionally, combined depiction of the complete cohort. Perioperative deaths were excluded. (b) Comparison of overall survival of patients with N0 or N1 status; p < 0.001. Perioperative deaths were excluded. (c) Comparison of overall survival of patients with solitary versus multifocal iCCA; p = 0.144. Perioperative deaths were excluded. (d) Comparison of overall survival of different UICC groups; p < 0.001. Subgroup comparison: UICC I vs. UICC II p = 0.002; UICC I vs. UICC III p < 0.001; UICC I vs. UICC IV p < 0.001; UICC II vs. UICC III p = 0.252; UICC II vs. UICC IV p = 0.014; UICC III vs. UICC IV p = 101. Perioperative deaths and patients with Nx status were excluded. (e) Comparison of overall survival of patients with visceral and/or vascular extension (VVE) versus no extension; p < 0.001. Subgroup comparison: no extension vs. VVE − infiltration p = 0.465; no extension vs. VVE + infiltration p < 0.001; VVE − infiltration vs. VVE + infiltration p = 0.007. Perioperative deaths were excluded. (f) Comparison of overall survival of patients without vascular extension (VE), VE without (−) infiltration and VE with (+) infiltration; p = 0.163. Subgroup comparison: no VE vs. VE − infiltration p = 0.746; no VE vs. VE + infiltration p = 0.058; VE − infiltration vs. VE + infiltration p = 0.125. Perioperative deaths were excluded.

