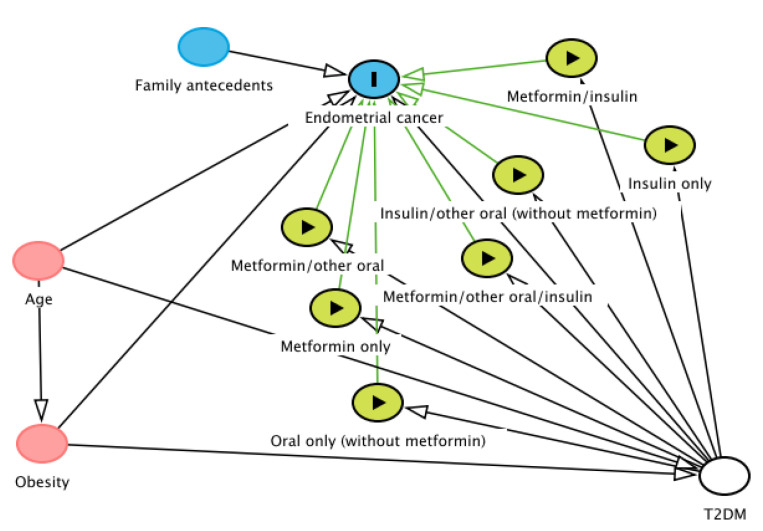
Figure 1.
Directed acyclic graph (DAG) showing causal assumptions on the effect of glucose-lowering medications (exposure) on endometrial cancer (outcome)*. * Adjusted variable (white color), ancestors of exposure and outcome (red color), exposures (green color), ancestor of outcome (blue color). Based on DAGitty version 3.0 (Johannes Textor, Nijmegen, the Netherlands).

