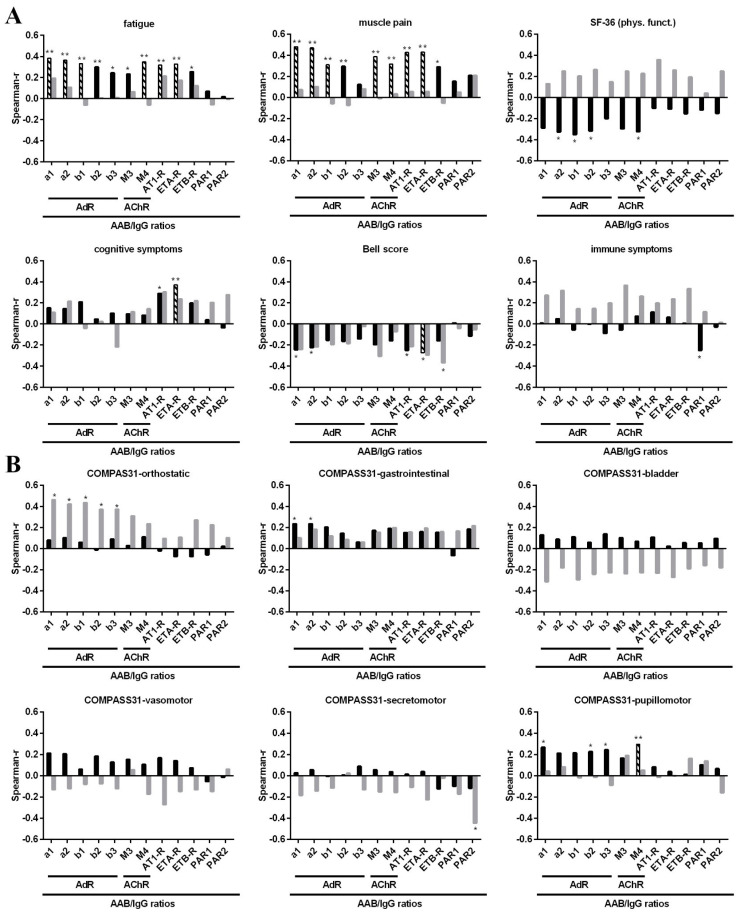
Figure 1.
Correlations between symptom severity and AAB/IgG ratios. Correlation analysis of AAB/IgG ratios with the severity of (A) fatigue, muscle pain, cognitive and immune symptom scores, physical functioning (SF-36) and Bell disability score and (B) with COMPASS 31 subdomains. Spearman correlation coefficients (r) are shown for patients with infection-triggered onset (black bars) and patients without infection-triggered onset (grey bars). Significant correlations prior to BH-correction are marked with asterisks (* p < 0.05, ** p < 0.01), correlations that remained significant after BH-correction are indicated by black-and-white striped bars.

