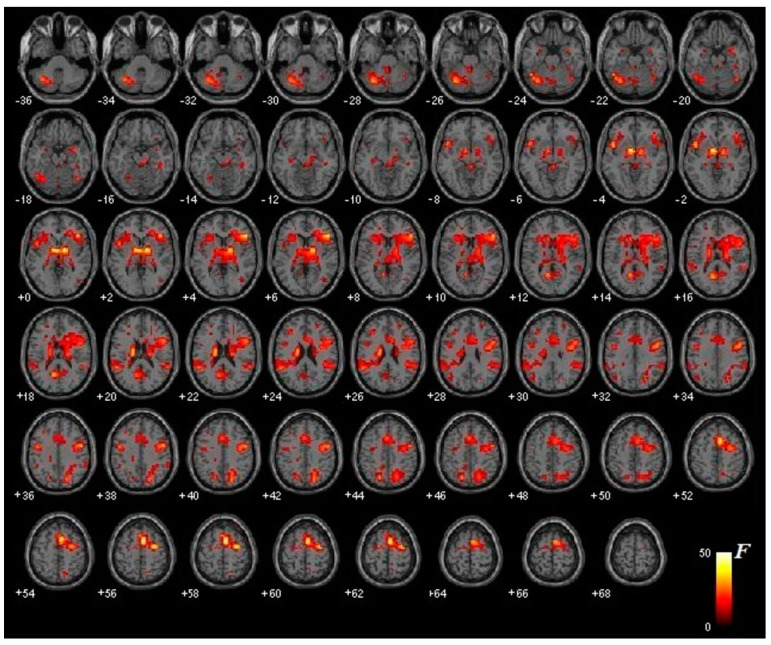
Figure 2.
Main treatment effect (p < 0.001). The figure shows the differential brain activation of all participants (intervention group and active control group) after treatment when presenting phobic stimuli (regardless of the type of image: virtual or real, depending on the group). The degree of activation ranges from red (not very intense) to white (very intense).

