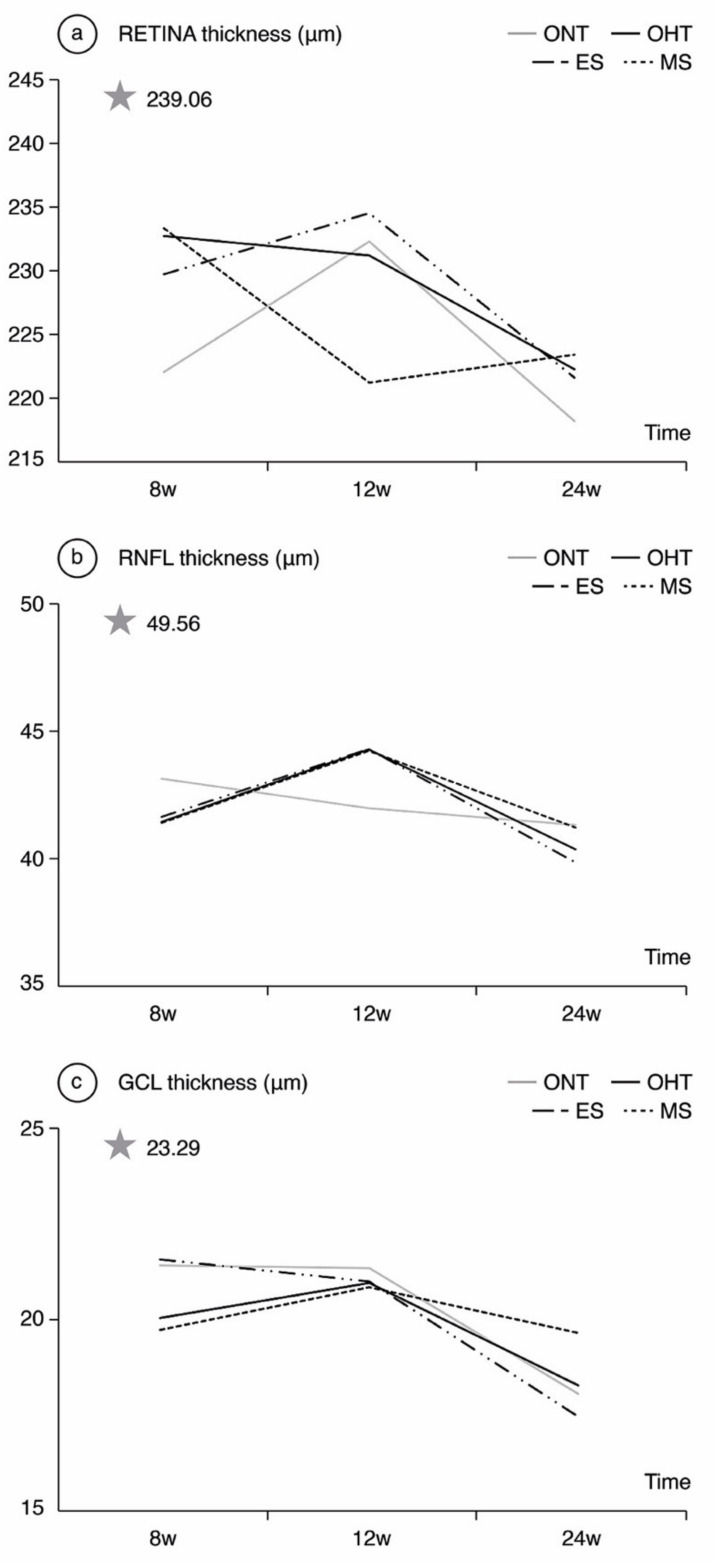
Figure 3.
Neuroretinal thickness measured by optical coherence tomography in both the ocular normotension and ocular hypertension cohorts and the ocular hypertension sub-groups at 8, 12, 24 weeks follow-up. (a) Retina thickness, (b) Retina nerve fiber layer thickness, (c) Ganglion cell layer thickness. The analysis is based on the mean values of all the OCT sectors. ONT: ocular normotension cohort; OHT: ocular hypertension cohort; ES: episcleral sclerosis group; MS: microspheres group; RNFL: retinal nerve fiber layer; GCL: ganglion cell layer; μm: thickness in micrometers; W: week; star: baseline thickness.

