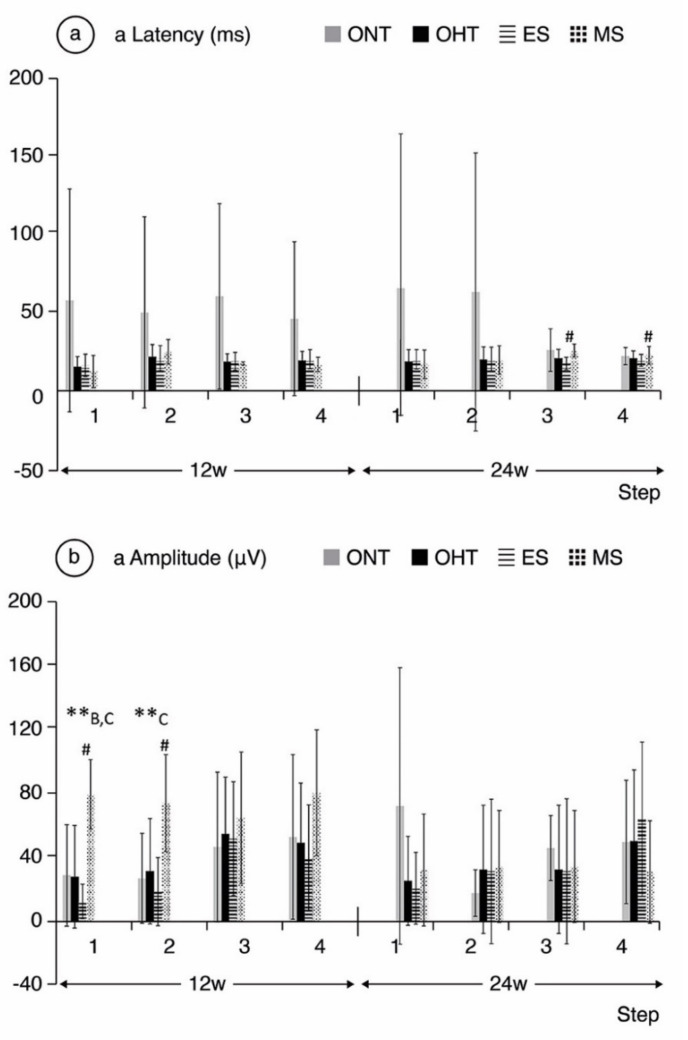
Figure 4.
a-wave electroretinographic response in both the ocular normotension and ocular hypertension cohorts and the ocular hypertension sub-groups at weeks 12 and 24. (a) a-latency in milliseconds of photoreceptors under scotopic conditions. (b) a-amplitude in microvolts of photoreceptors under scotopic conditions. Abbreviations: ONT: ocular normotension group; OHT: ocular hypertension group; ES: episcleral sclerosis group; MS: microspheres group; w: week; ms: milliseconds; µV: microvolts; **: statistical differences between groups (ONT vs. ES vs. MS) (Kruskal–Wallis); #: statistical differences between the ES and MS groups; A: statistical differences between ONT and ES; B: statistical differences between ONT and MS; C: statistical differences between ES and MS. Scotopic test (rod response): step 1: −40 dB, 0.0003 cds/m2, 0.2 Hz (20 recordings averaged); step 2: −30 dB, 0.003 cds/m2, 0.125 Hz (18 recordings averaged); step 3: −20 dB, 0.03 cds/m2, 8.929 Hz (14 recordings averaged); step 4: −20 dB, 0.03 cds/m2, 0.111 Hz (15 recordings averaged).

