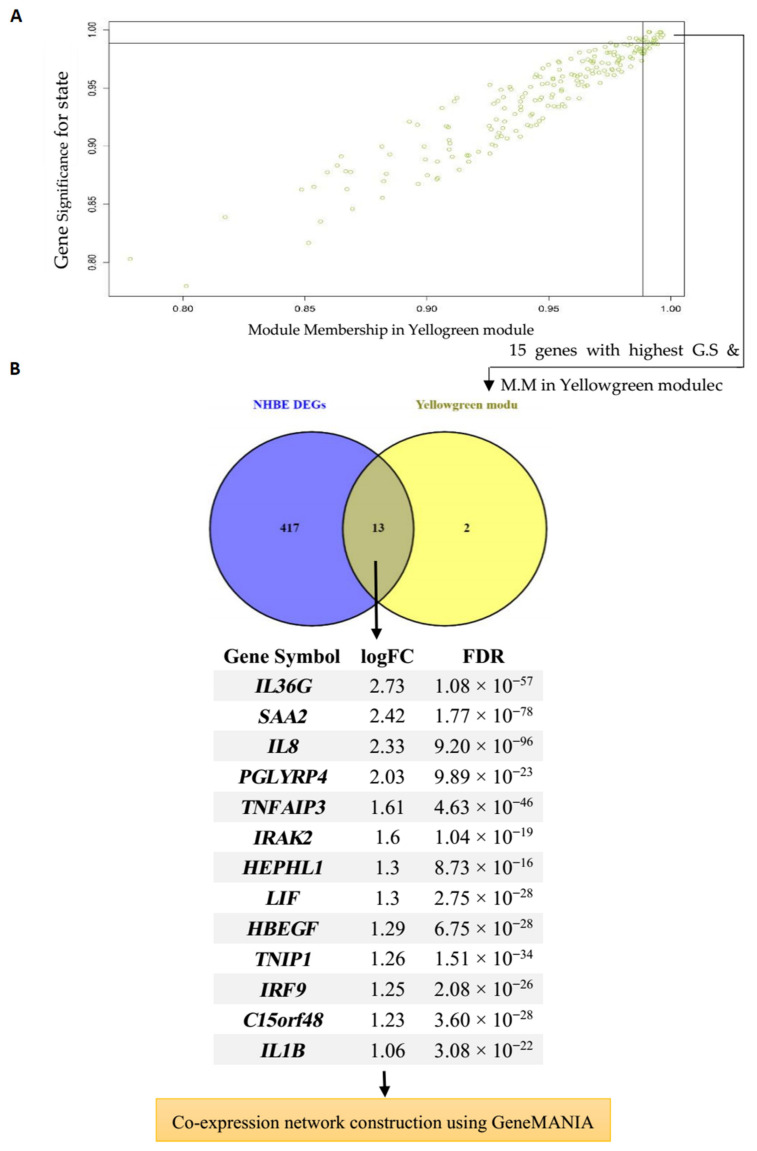
Figure 5.
Hub gene detection for NHBE dataset. (A) Yellow-green module features of G.S and M.M significantly correlated with the SARS-CoV-2 trait (mock-infected and SARS-CoV-2-infected). Each point represents an individual gene within each module, which is plotted by G.S on the y-axis and M.M on the x-axis; (B) Evaluation of similarities between DEG and hub gene lists using a Venn diagram. Thirteen genes that were similar in both lists were then imported to GeneMANIA to construct a co-expression network.

