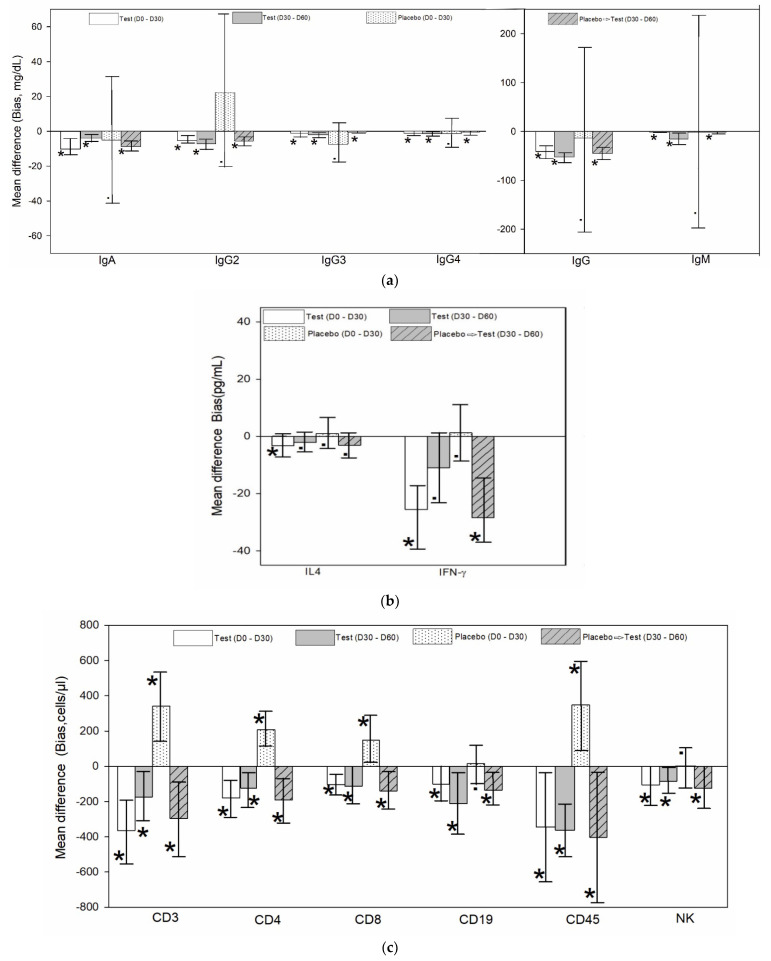
Figure 3.
Representative figure for the Bland–Altman analysis data in participants treated with test (WS) and placebo. (a) Comparison of mean difference (bias) and confidence intervals for the bias of immunoglobulin level (mg/dL) in serum (n = 12/group) for the study period (day 0–30) and extension period (day 30–60). The plots are represented in two scale ranges for better presentation of data. (b) Comparison of mean difference (bias) and confidence intervals for the bias of cytokine level (pg/mL) in serum (n = 12/group) for the study period (day 0–30) and extension period (day 30–60). (c) Comparison of mean difference (bias) and confidence intervals for the bias of T cells (CD3+, CD4+, CD8+), B cells (CD19+), CD45+, and NK absolute cell counts (cells/µL) in whole blood (n = 12/group) for the study period (day 0–30) and extension period (day 30–60). The data show the tip of the column corresponding to the mean difference (bias) and the whiskers showing confidence intervals for the bias. The data are taken from independent Bland–Altman plot generated for each parameter and period. (See Supplementary File 2 for actual Bland–Altman plot and tables for each parameter). Placebo➔ Test indicates placebo group crossed over to the test group at the extension period of the study. * Significant at (p < 0.05). • Not significant (p > 0.05).

