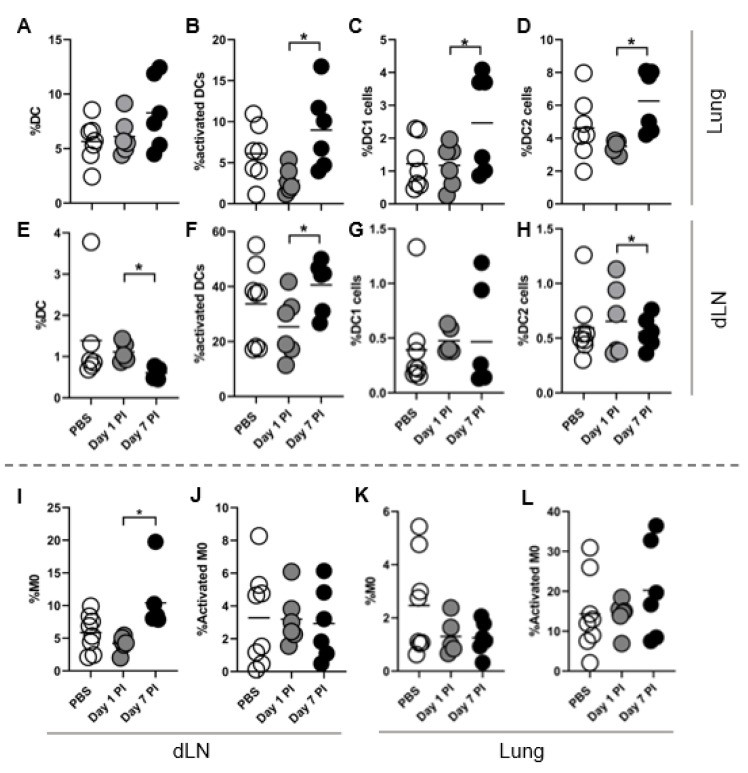
Figure 5.
DC1 and DC2 increase in frequency at day 7 post-infection. C57BL/6 mice were intranasally infected with 105 arthroconidia or PBS. Cell frequencies are comparable to uninfected mice (data not shown). Both lung lobes were collected and homogenized for flow cytometry analysis. Draining lymph node (dLN) refers to the pulmonary lung-draining LN. DC1 (C,G) and DC2 (D,H) populations are gated from CD11c+ population (A,E). DC1 are defined as CD8a+SIRPa-CD11c+ and DC2 as CD8a-SIRPa+CD11c+. (B,F) Activated DC frequency accounts for all DCs including DC/DC1/DC2. (I,K) Macrophages are defined as F4/80+ cells and (J,L) activated population is gated from the F4/80+ population. Activated cells are defined as CD86+MHC-II+ cells. n = 6–8 individual mice from 3 experiments. For all plots displayed line indicates mean and each dot is one experimental replicate. Comparisons were made between mock PBS infection and infected at each time point. Data was analyzed using unpaired Student’s t-test and outliers excluded using Grubbs Outlier exclusion analysis; * p < 0.05.

