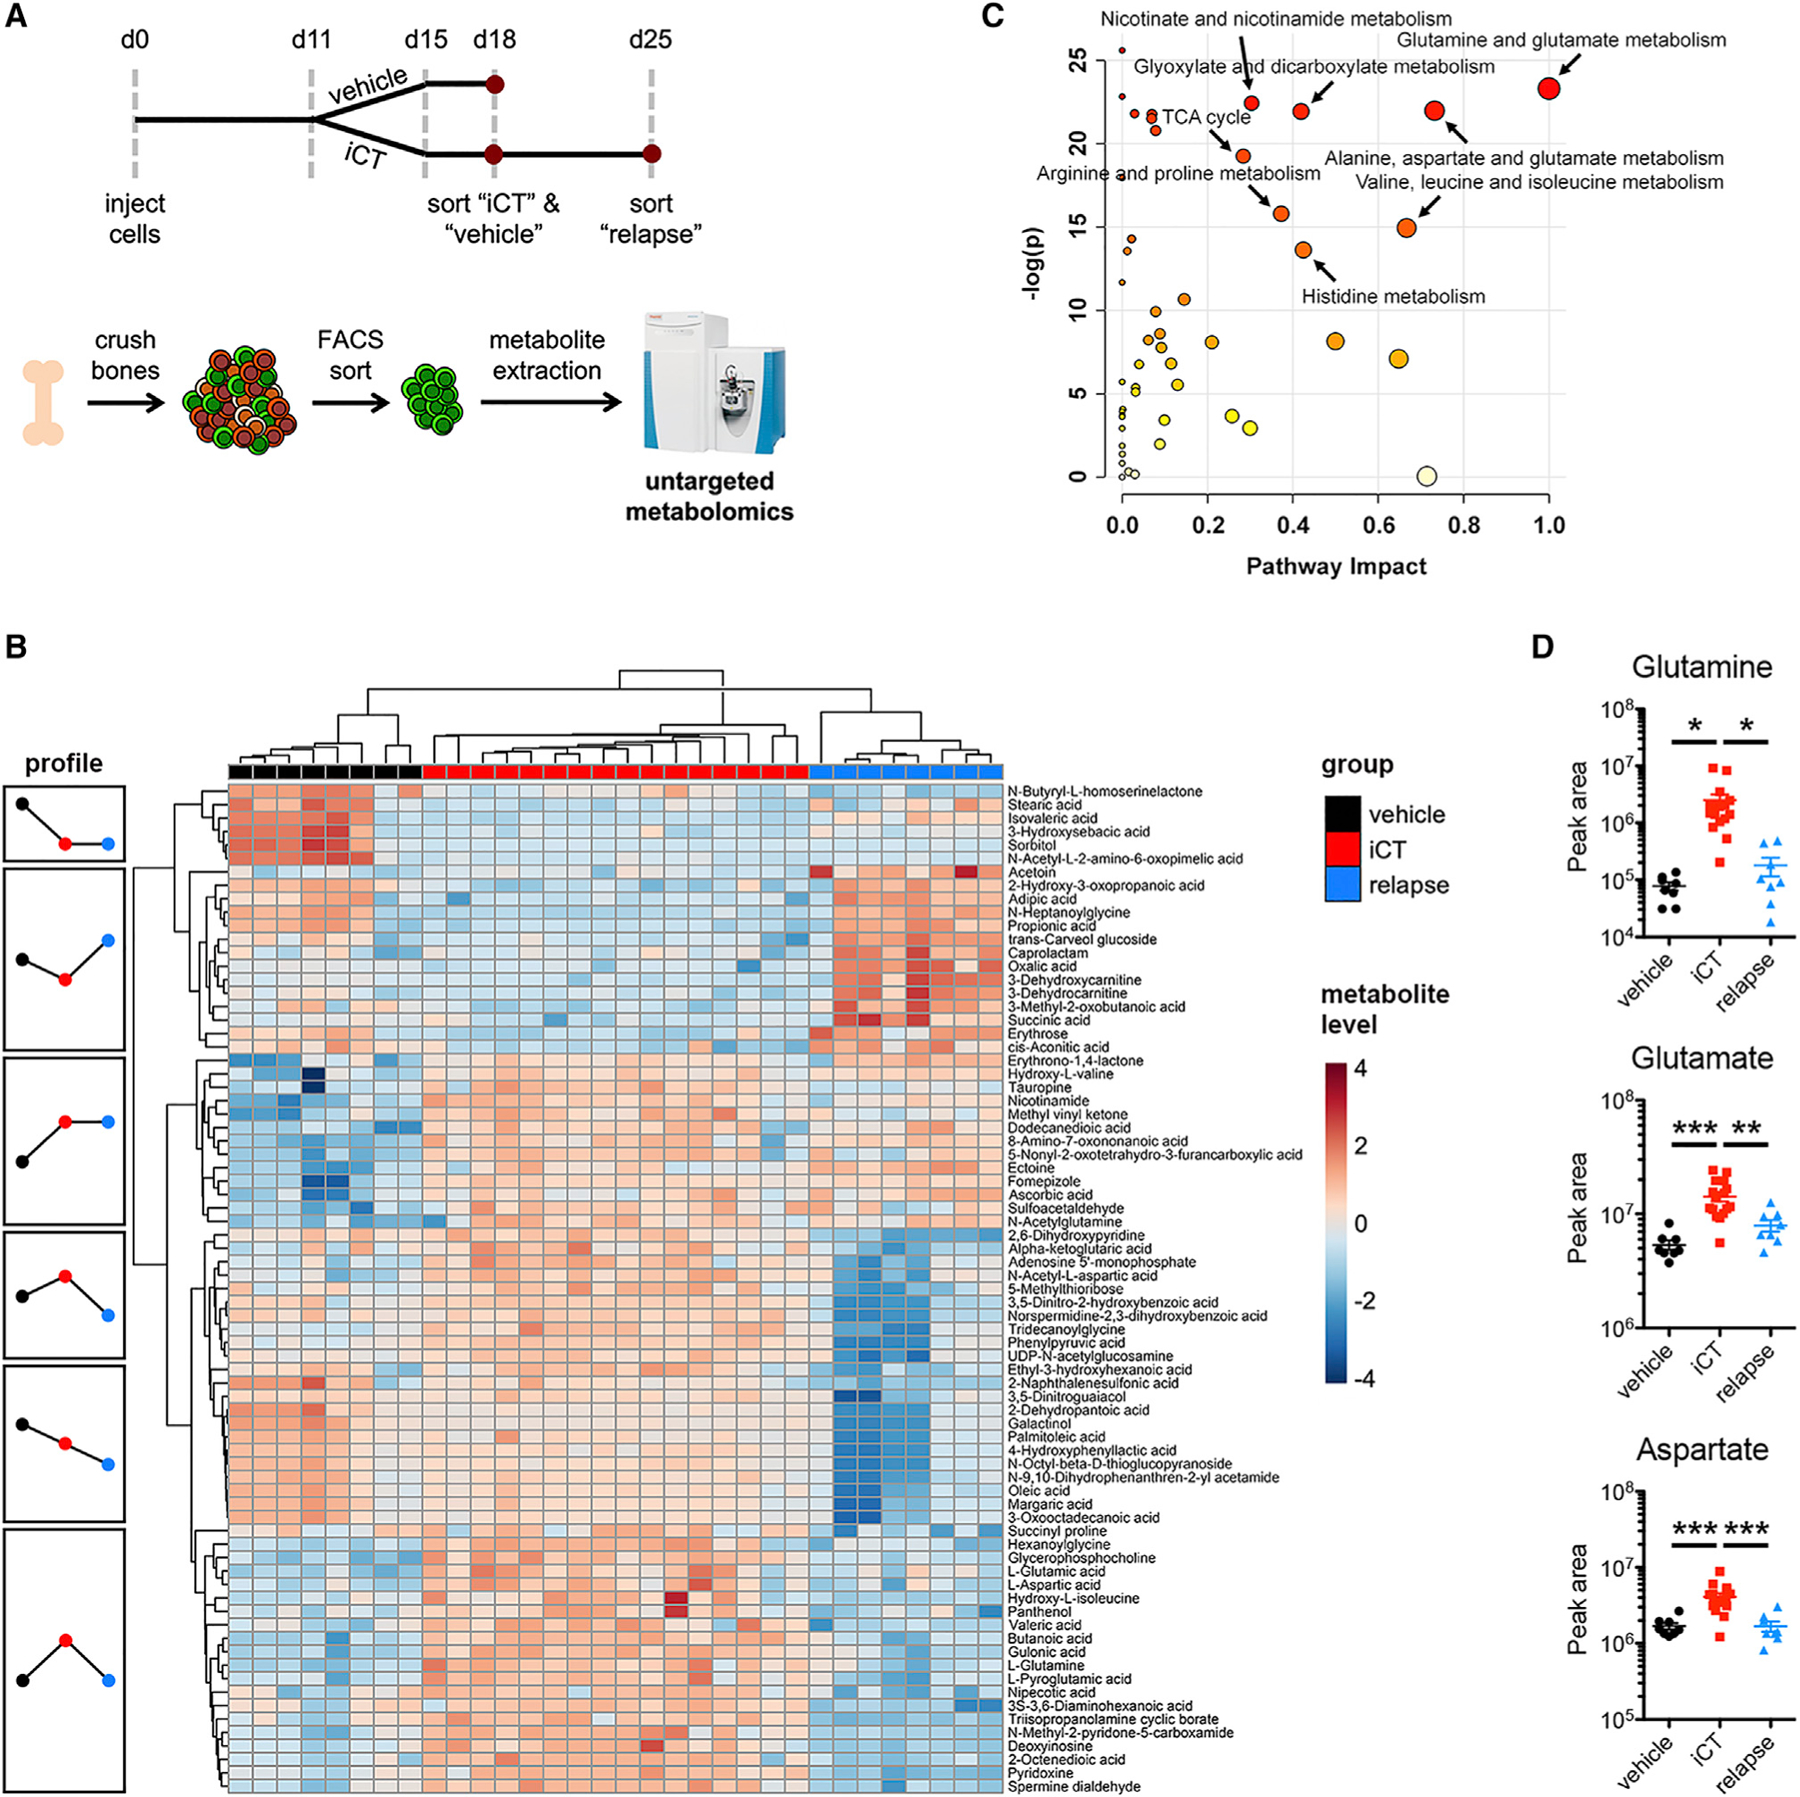
Figure 1. AML Cells Exhibit Transient Metabolic Changes in Response to Chemotherapy.

(A) Schematic overview of the experimental design. iCT, induction chemotherapy (5 days of cytarabine 100 mg/kg + 3 days of doxorubicin 3 mg/kg i.p.).
(B) Heatmap of the metabolic profile of MLL-AF9 AML cells obtained from mice with vehicle treatment, at 3 days after iCT (iCT group; representing the moment of maximal response) or at 10 days after iCT (relapse).
(C) Metabolic Pathway Enrichment Analysis using putatively identified metabolites of the iCT versus vehicle and relapse groups. Pathway impact is a measure for the percentage of metabolites that were measured in a given pathway, as well as their relative importance in that pathway.
(D) Levels of glutamine, glutamate, and aspartate in vehicle, iCT, or relapse MLL-AF9 AML cells as measured by untargeted metabolomics. Data are represented as mean ± standard error of the mean (SEM). *p < 0.05, **p < 0.01, ***p < 0.001. See also Figure S1.
