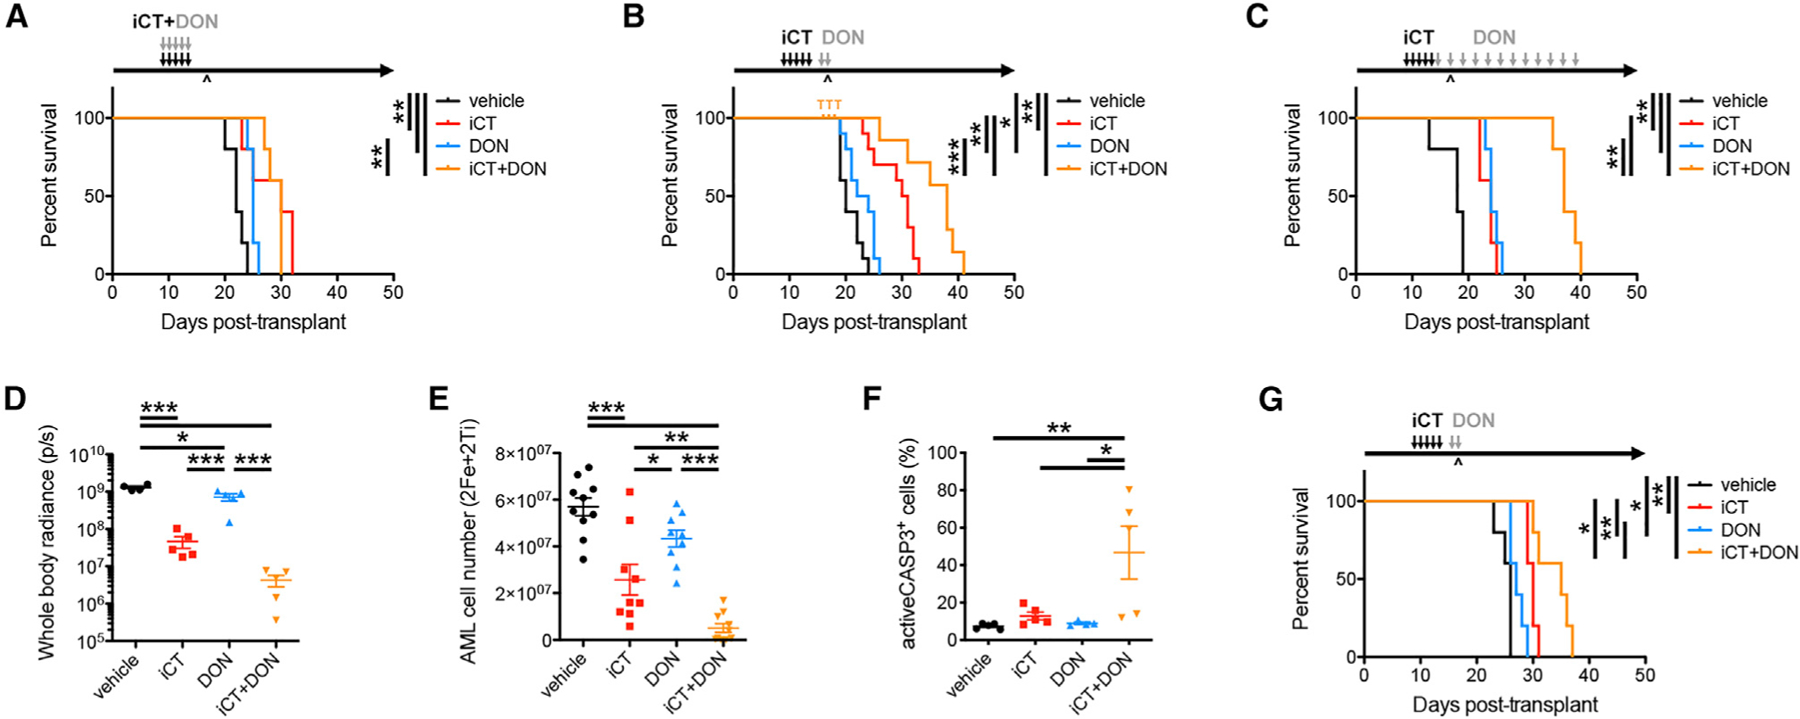
Figure 2. Timed Inhibition of Glutamine Metabolism Overcomes Chemoresistance in AML.

(A–C) Survival curves of MLL-AF9 AML-bearing mice treated with iCT and/or 6-diazo-5-oxo-L-norleucine (DON; 0.3 mg/kg i.p.) concomitantly (A, n = 5 mice per group) or sequentially (B and C). For sequential treatments, mice were either treated with 2 doses of DON at the moment of maximal response (B, n = 10 mice per group) or continuously with DON every other day following iCT (C, n = 5 mice per group). T, death due to drug toxicity; ^, moment of maximal response.
(D and E) Disease burden of MLL-AF9 AML-bearing mice treated sequentially with iCT and/or DON (regimen as in B), determined 1 day after the last dose of DON through bioluminescence imaging (D) or flow cytometry (E).
(F) Percentage of apoptotic cells in MLL-AF9 AML cells obtained from mice treated sequentially with iCT and/or DON (regimen as in B), determined 1 day after the last dose of DON.
(G) Survival curves of HoxA9/Meis1 AML-bearing mice treated sequentially with iCT and/or 2 doses of DON (0.3 mg/kg i.p.) specifically targeting the moment of maximal response (n = 5 mice per group). Data are represented as mean ± SEM. *p < 0.05, **p < 0.01, ***p < 0.001. See also Figure S2.
