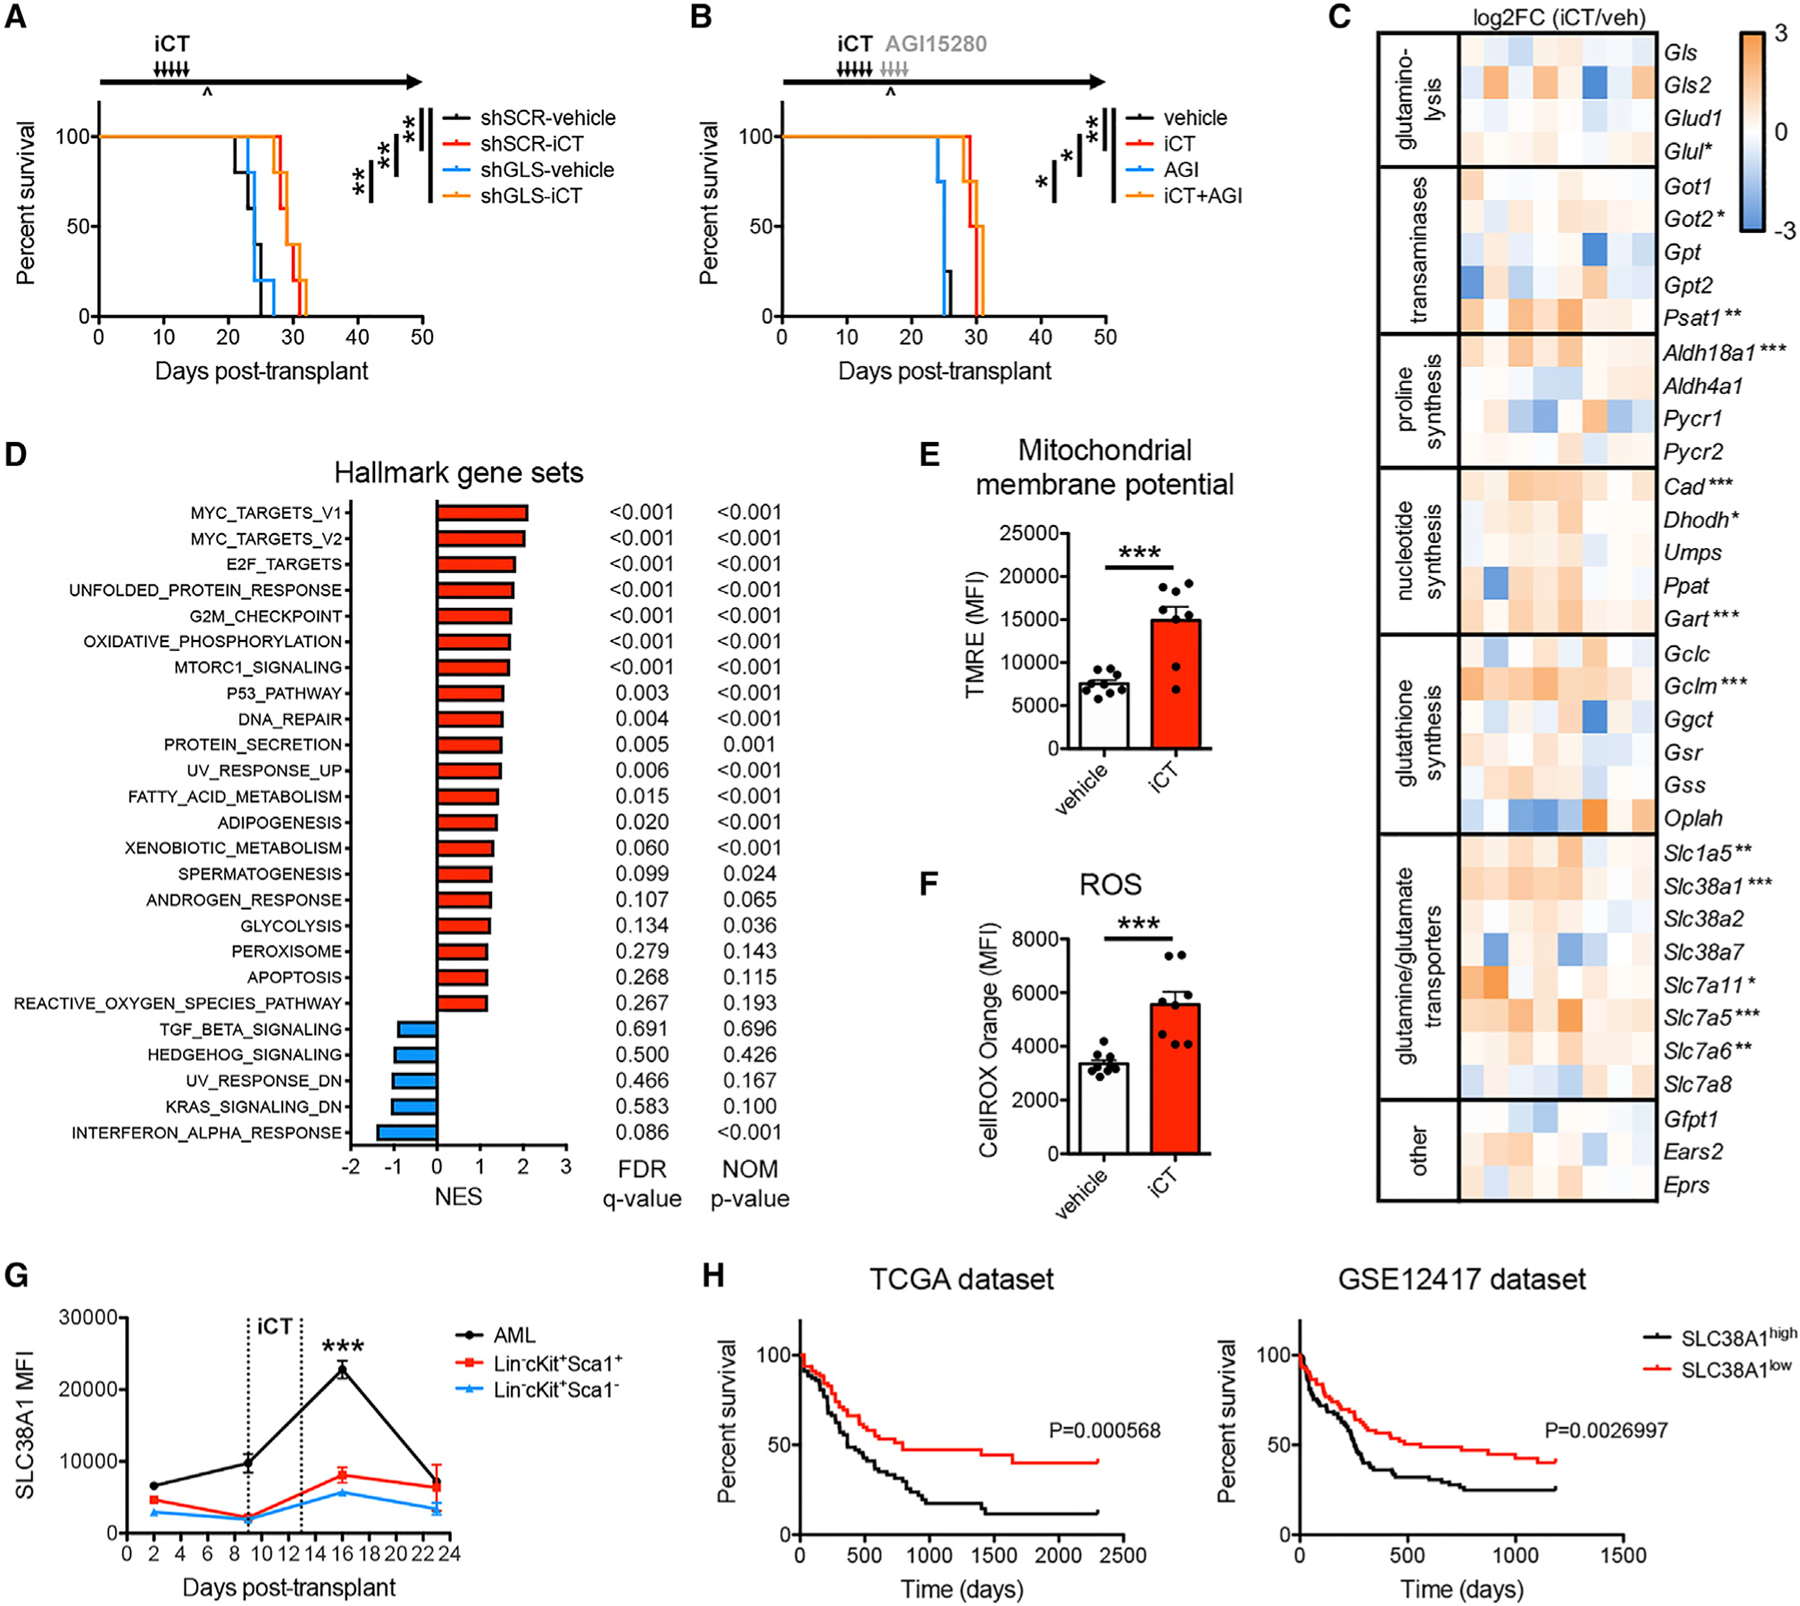
Figure 3. Residual AML Cells Do Not Depend on Glutaminase.

(A) Survival curve of mice engrafted with MLL-AF9 AML cells transduced with scrambled short hairpin RNA (shSCR) or shRNA targeting glutaminase (shGLS), treated with iCT or vehicle (n = 5 mice per group).
(B) Survival curves of MLL-AF9 AML-bearing mice treated sequentially with iCT and/or 4 days of AGI15280 (150 mg/kg twice daily, p.o.) targeting the moment of maximal response (n = 4 mice per group). ^, moment of maximal response.
(C) Heatmap of RNA sequencing data of genes related to glutamine metabolism in MLL-AF9 AML cells obtained from mice treated with vehicle or iCT, at the moment of maximal response.
(D) Gene set enrichment analysis in iCT- versus vehicle-treated MLL-AF9 AML cells obtained at the moment of maximal response. NES, normalized enrichment score; FDR, false discovery rate; NOM, nominal.
(E and F) Mitochondrial membrane potential measured by tetramethylrhodamine ethyl ester (TMRE) staining (E), and levels of ROS measured by CellROX Orange staining (F) in MLL-AF9 AML cells obtained from mice treated with vehicle or iCT, at the moment of maximal response.
(G) Flow cytometric analysis of SLC38A1 protein levels on MLL-AF9 AML cells and on Lin−cKit+Sca1+ and Lin−cKit+Sca1− normal hematopoietic stem and progenitor cells, at different times during the course of iCT treatment.
(H) Survival curves of AML patients grouped according to the expression of SLC38A1 above or below the median. Data were obtained from the TCGA dataset or the GSE12417 dataset. Data are represented as mean ± SEM. *p < 0.05, **p < 0.01, ***p < 0.001. See also Figure S3.
