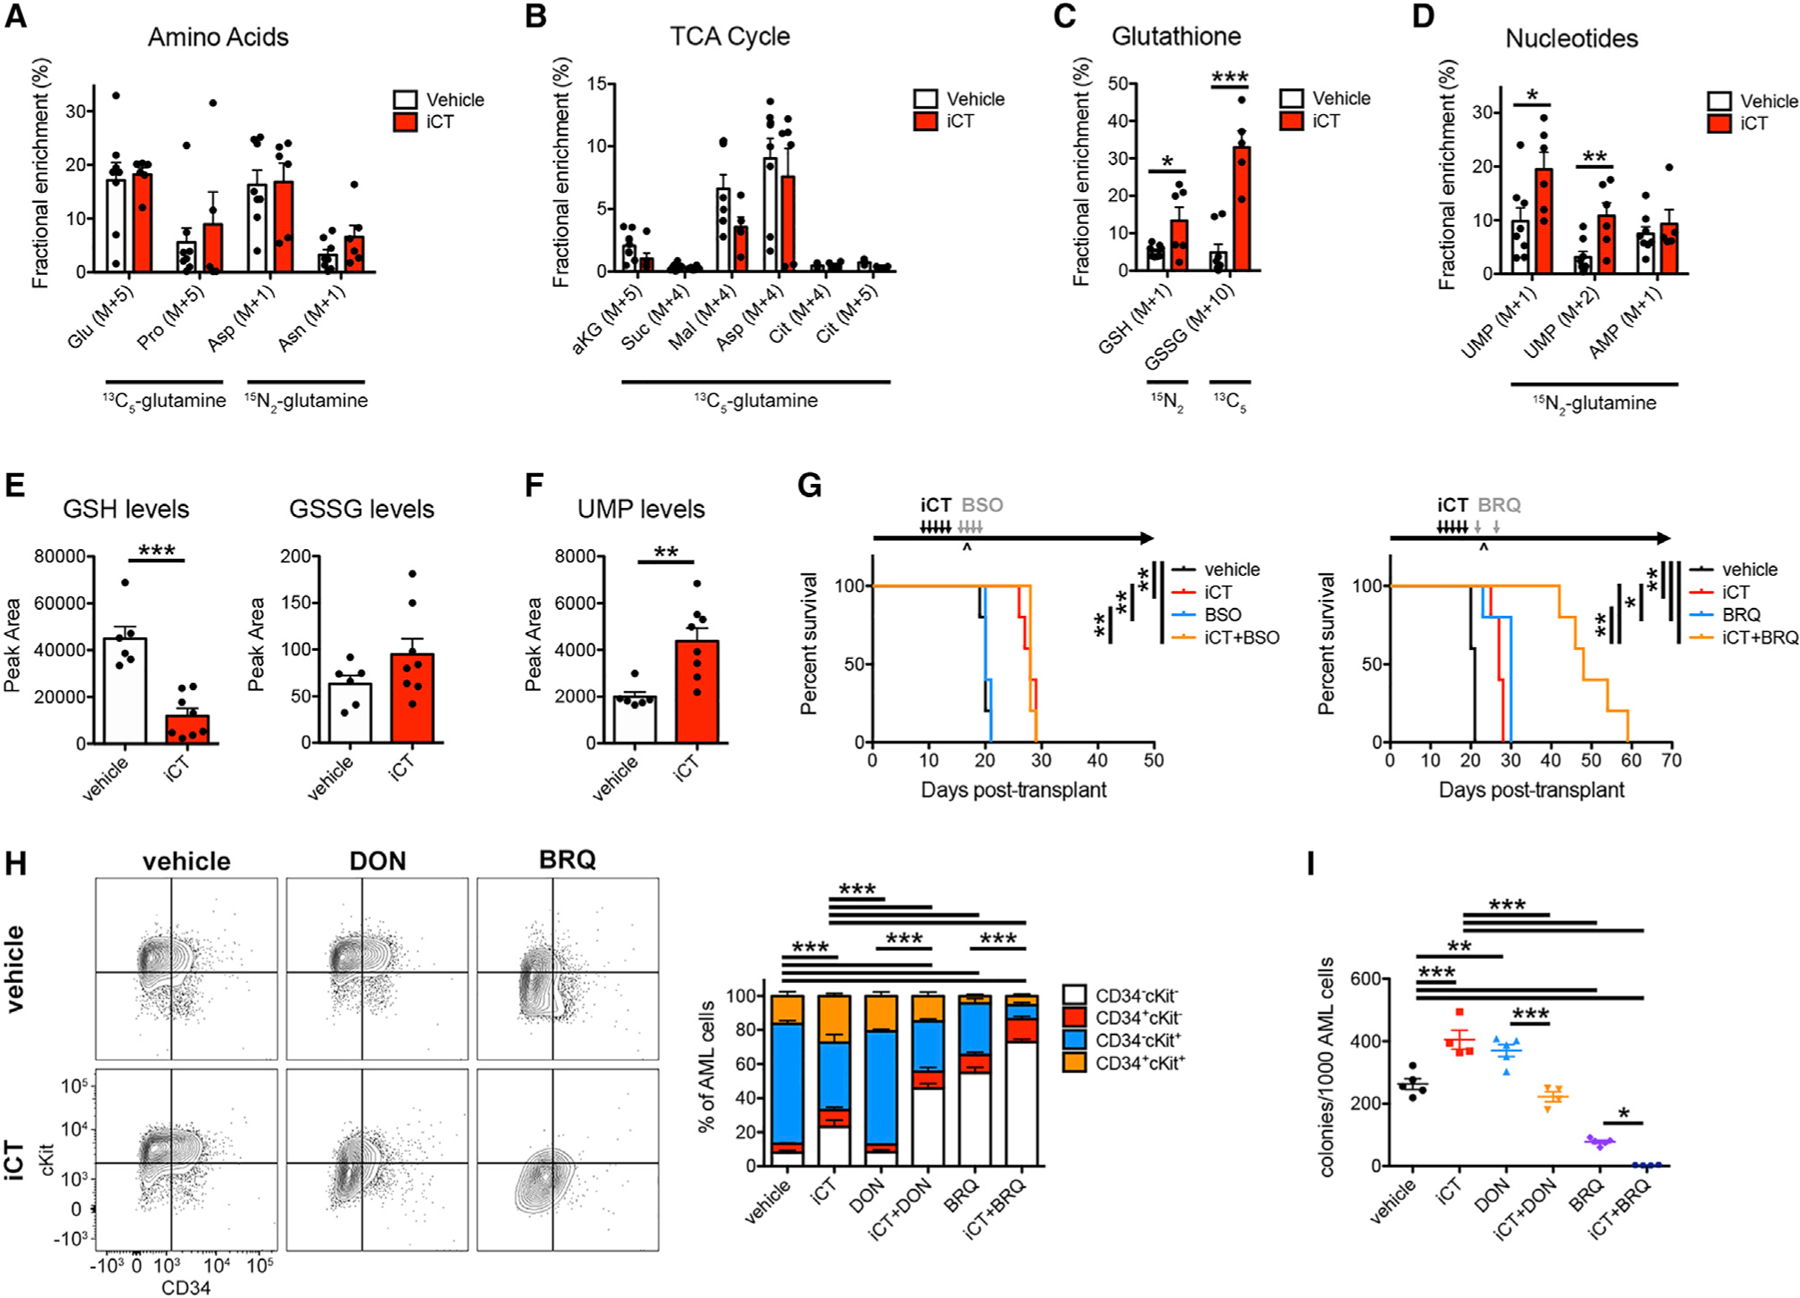
Figure 4. Glutamine Metabolism Drives AML Chemoresistance by Fueling Pyrimidine Synthesis.

(A–D) Contribution of glutamine carbon and nitrogen to amino acids (A), the TCA cycle (B), glutathione (C), and nucleotides (D) in MLL-AF9 AML cells obtained from vehicle- and iCT-treated mice at the moment of maximal response. Glu, glutamate; Pro, proline; Asp, aspartate; Asn, asparagine; Akg, alpha-ketoglutarate; Suc, succinate; Mal, malate; Cit, citrate; GSH, reduced glutathione; GSSG, oxidized glutathione; UMP, uridine 5′-monophosphate; AMP, adenosine 5′-mono-phosphate.
(E and F) Levels of GSH and GSSG (E) or UMP (F) in MLL-AF9 AML cells obtained from vehicle- and iCT-treated mice at the moment of maximal response.
(G) Survival curves of MLL-AF9 AML-bearing mice treated sequentially with iCT and/or L-buthionine-sulfoximine (BSO, 2.23 mg/kg twice daily, i.p. + 4.45 mg/ml in drinking water; n = 5 mice per group; left) or Brequinar (BRQ, 50 mg/kg, i.p.; n = 5 mice per group; right). ^, moment of maximal response.
(H and I) Flow cytometric analysis of CD34 and cKit levels (H) and colony-forming capacity (I) in AML cells obtained from mice sequentially treated with iCT and/or DON (regimen as in Figure 2B) or BRQ (regimen as in G), determined 4 days after the last dose of iCT. Data are represented as mean ± SEM. *p < 0.05, **p < 0.01, ***p < 0.001. See also Figure S4.
