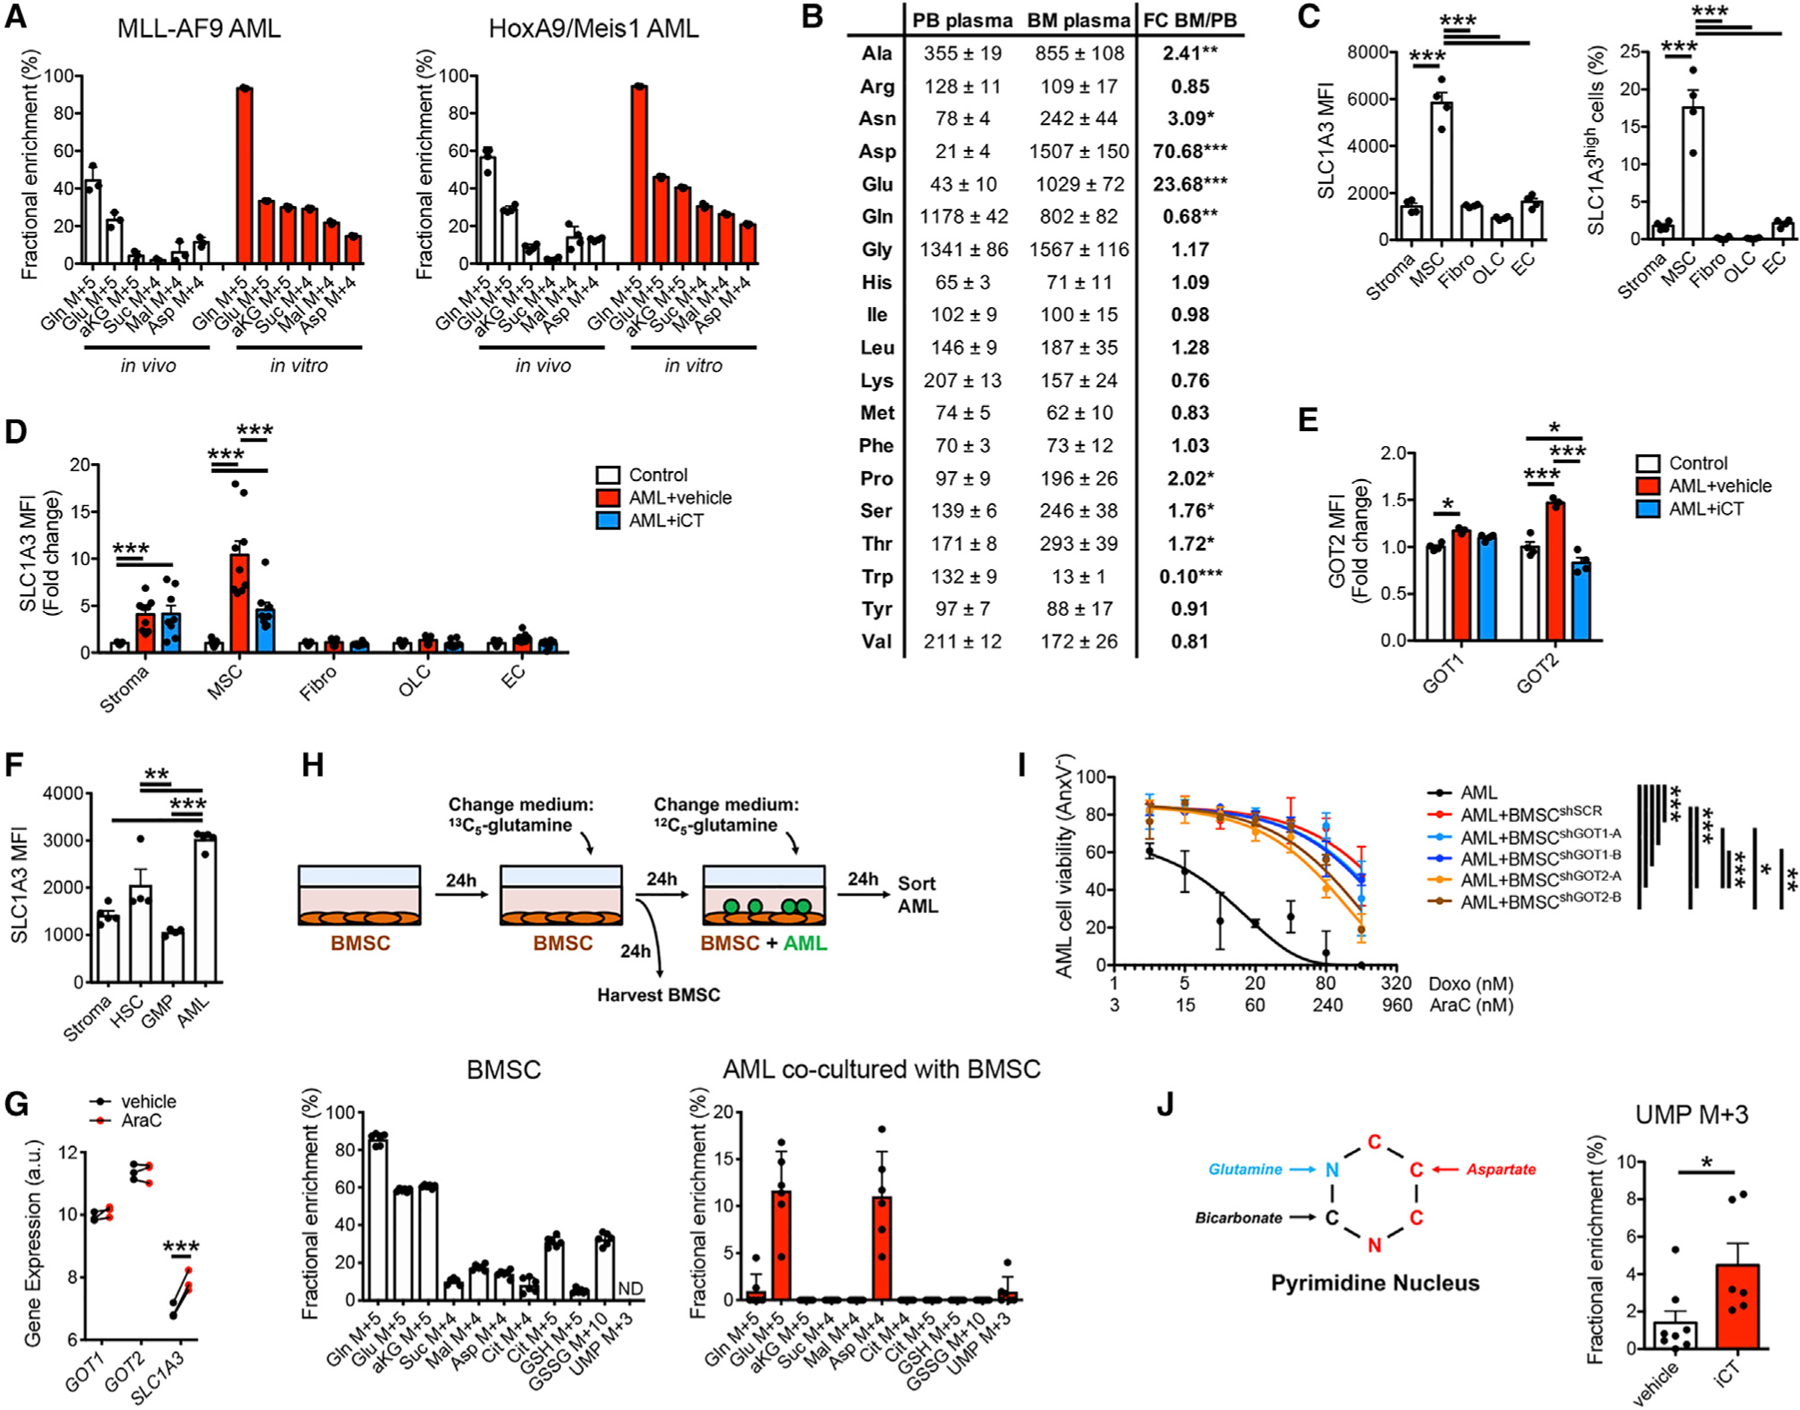
Figure 5. Bone Marrow Stromal Cell-Derived Aspartate Supports Pyrimidine Synthesis in AML Cells.

(A) Labeling of glutamine metabolism and TCA cycle metabolites in MLL-AF9 and HoxA9/Meis1 AML cells by 13C5-glutamine in vivo and in vitro (10 min labeling).
(B) LC-MS-based quantification of amino acid levels in PB and BM plasma of control mice. FC, fold change.
(C) Flow cytometric analysis of SLC1A3 protein levels on BMSC subpopulations in control mice. Stroma, total stromal cells (CD45−Ter119−); MSC, mesenchymal stromal cells (CD45−Ter119−CD31−LepR+), Fibro: fibroblasts (CD45−Ter119−CD31−LepR Sca1+CD90+), OLC, osteolineage cells: (CD45−Ter119−CD31−LepR−Sca1−CD90lowCD105+); EC, endothelial cells (CD45−Ter119−CD31+CD105+); MFI, mean fluorescence intensity.
(D) Flow cytometric analysis of SLC1A3 protein levels on BMSC subpopulations obtained from vehicle- or iCT-treated MLL-AF9 AML-bearing mice at the moment of maximal response, compared with control mice.
(E) Flow cytometric analysis of intracellular GOT1 or GOT2 protein levels in MSCs obtained from vehicle- or iCT-treated MLL-AF9 AML-bearing mice at the moment of maximal response, compared with control mice.
(F) Flow cytometric analysis of SLC1A3 protein levels on stromal cells (CD45−Ter119−), hematopoietic stem cells (HSCs; Lin−cKit+Sca1+CD48−CD150+), granulocyte-monocyte progenitor cells (GMP; Lin-cKit+Sca1−CD34+CD16/32+), and MLL-AF9 AML cells.
(G) Expression of GOT1, GOT2, and SLC1A3 by human AML PDX cells isolated from mice treated with cytarabine or vehicle. Data obtained from Farge et al. (2017) (GSE97631).
(H) 13C5-glutamine tracing in co-cultures of BMSC and MLL-AF9 AML cells.
(I) Viability of MLL-AF9 AML cells in monoculture or co-culture with BMSCs transduced with shSCR, shGOT1, or shGOT2, in response to different doses of cytarabine (AraC) and doxorubicin (Doxo).
(J) Labeling of UMP by 13C5-glutamine in MLL-AF9 AML cells obtained from vehicle- or iCT-treated mice at the moment of maximal response. Data are represented as mean ± SEM. *p < 0.05, **p < 0.01, ***p < 0.001. See also Figure S5.
