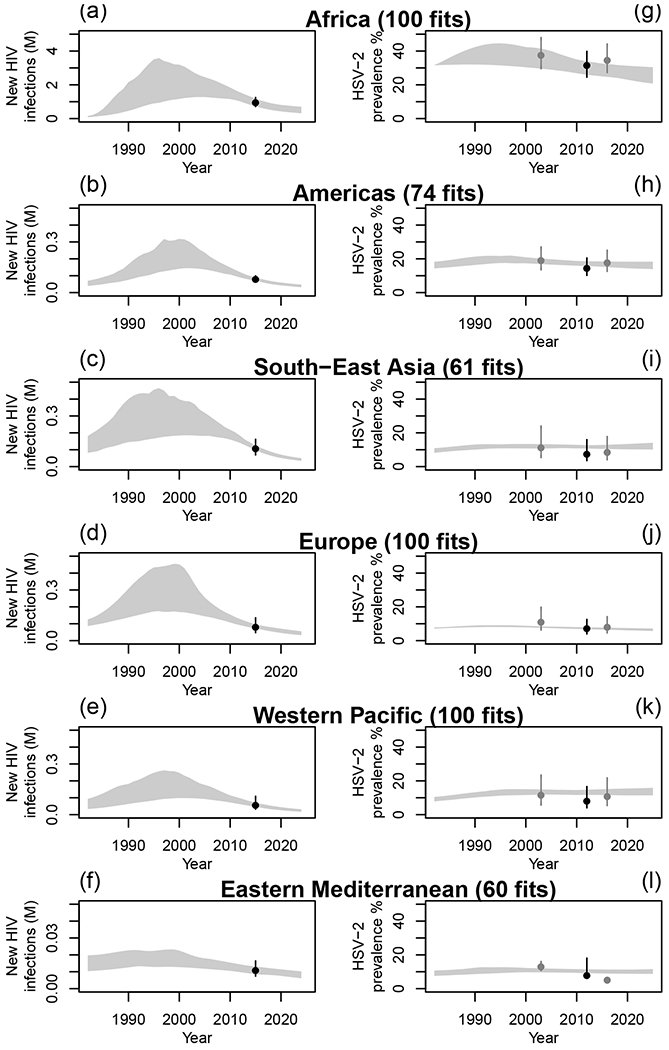
Figure 1: WHO-region-specific annual numbers of incident HIV infections and HSV-2 prevalence.

Model fits to available estimates of annual numbers of incident HIV infections (in millions (M)) from UNAIDS46,49 (panels a-f) and HSV-2 prevalence44 (panels g-l) among heterosexual non-PWID individuals, for each WHO region. Grey shaded areas represent the 95%UI of model predictions across all parameter sets. Dark dots and intervals represent empirical estimates used for fitting and grey dots and intervals represent empirical estimates only used for comparison (i.e. not used at the fitting stage).44
