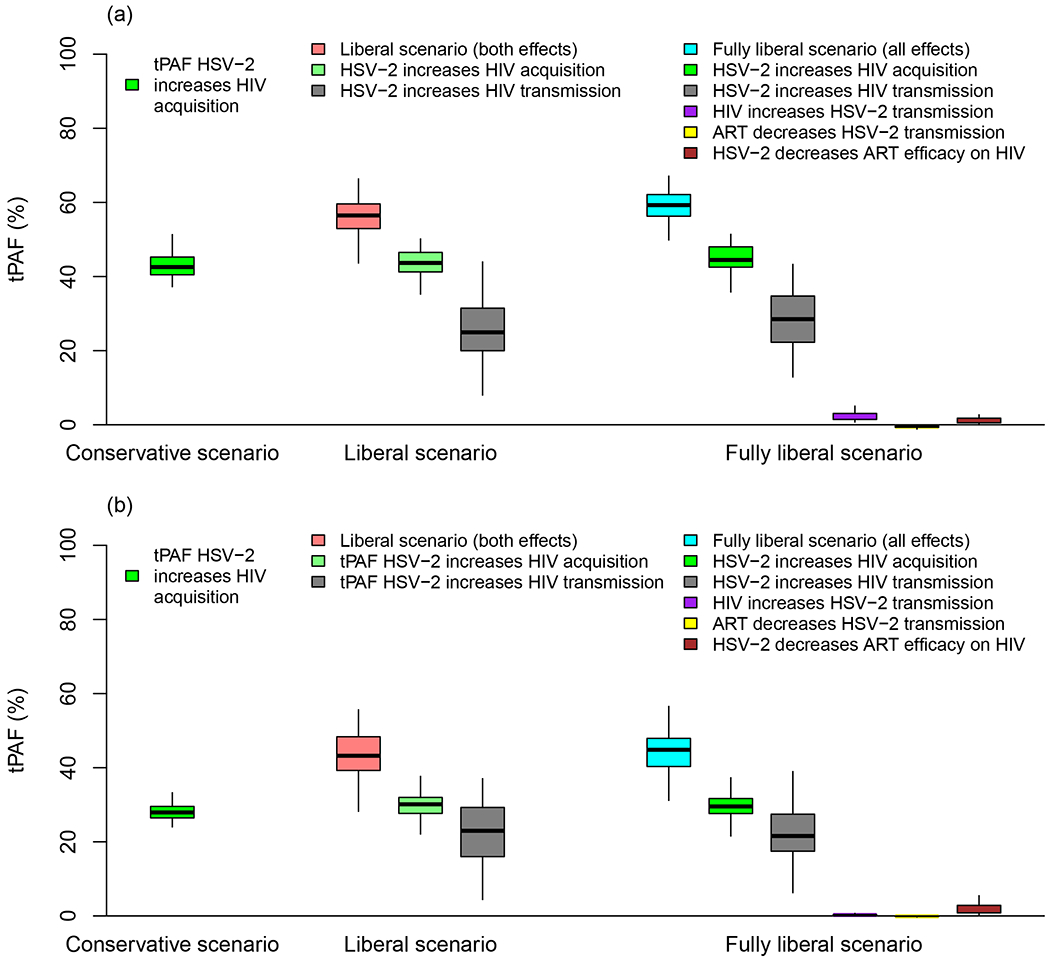
Figure 3: Contribution of each cofactor effect to HIV incident infections over 2009-2018.

Boxplot shows the transmission population-attributable fraction (tPAF) of each cofactor effect included in each of the three modelled scenarios in WHO a) Africa and b) Americas region. Boxplots represent median, interquartile range, and 95% UI.
