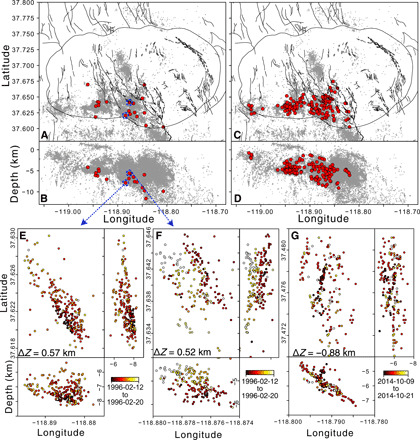
Fig. 5. Spatial distribution of clusters with large () and small () mean migration distance.

(A and B) Map and east-west views of large migration distance root event locations. Blue circles and arrows show nucleation points of clusters shown in (E) and (F). (C and D) Small migration distance root event locations. Note that while the nonmigrating clusters occur throughout the seismogenic zone, the upward migrating clusters occur exclusively near its base. (E and F) Examples of ascending clusters in plan and section views, where color indicates time. (G) Example of a descending cluster in plan and section views, where color indicates time.
