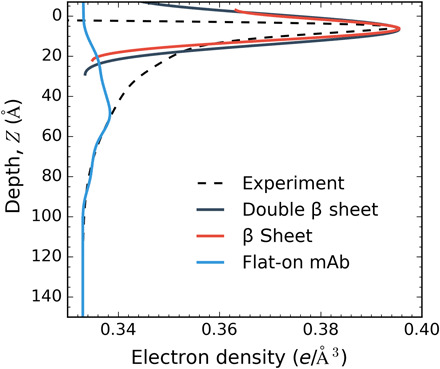
Fig. 6. β Sheet formation at the air/water interface.

The simulated EDP for a β sheet represents the first 6-Å peak of the experiment EDP. A comparison of the β sheet (red), double β sheet (black), and flat-on mAb (blue) is included for comparison purposes to show that the broad EDP profiles do not represent the first peak of experimental EDP.
