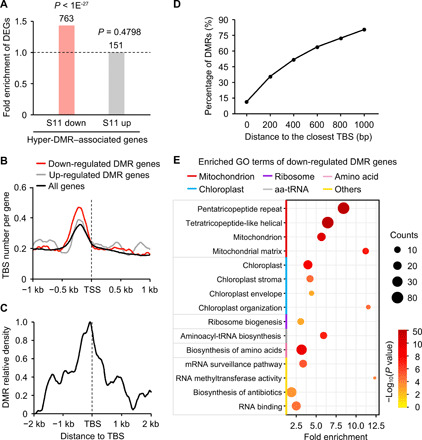
Fig. 3. Hypermethylation of TBS and down-regulation of TCP-target genes during inbreeding.

(A) Fold enrichment of differentially expressed genes (DEGs) in CHH hyper-DMR–associated genes. P values were calculated by Fisher’s exact test. (B) Number of TBS per gene within 1 kb of TSS (marked by dashed line). (C) Density of CHH hyper-DMRs within 2 kb of TBS. (D) Percentage of DMRs relative to the distance from the TBS. (E) Down-regulated genes with DMRs were overrepresented by gene ontology (GO) terms involved in mitochondrion, chloroplast, and ribosome biosynthesis (P < 0.01 and counts ≥5) using DAVID analysis (40). aa-tRNA, aminoacyl-tRNA.
