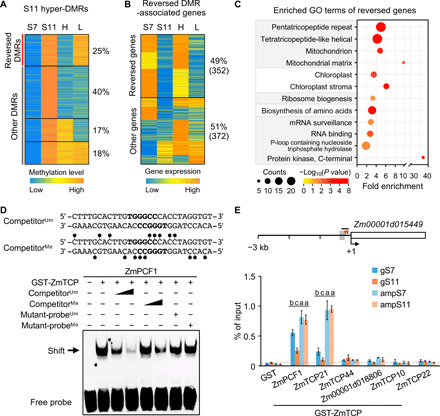
Fig. 4. Inbreeding-induced hypermethylation is reversed by random mating and analysis of ZmTCP binding affinity to methylated TBS.

(A) K-means clustering of CHH methylation levels in hyper-DMRs among S7, S11, high (H), and low (L) vigor M11 lines. (B) K-means clustering of expression levels of the genes associated with reversed DMRs. (C) GO-enriched terms of the genes with reversed expression levels (P < 0.05 and counts of ≥5). (D) Reduced binding affinity of recombinant ZmPCF1 protein to methylated probes containing TBS motifs (bold letters) in EMSA. Competition assays used unmethylated probes (competitorUm, 100× and 500× excess), methylated probes (competitorMe, 100× and 500× excess), unmethylated mutant probes (mutant-probeUm, 500× excess), or methylated mutant-probes (mutant-probeMe, 500× excess). CHH methylation sites (lollipop) are shown in the competitorMe sequence. The band shift is indicated by the arrow. (E) DNA affinity purification (DAP)–qPCR analysis of recombinant ZmTCP proteins using genomic DNA of S7 and S11 (gS7 and gS11) and PCR-amplified genomic DNA from S7 and S11 (ampS7 and ampS11). Diagram of the Zm00001d015449 promoter region (3-kb upstream) shows locations of two TBS motifs (red arrowheads), CHH hyper-DMR (gray box), and the fragment (short black line) used in DAP-qPCR assays. Numbers shown are relative to the TSS (+1). Ratio of GST-ZmTCP/GST ≥ 5 was used to show binding of ZmTCP protein to the TBS fragment using the purified GST protein as the negative control. Different letters above each column indicate statistical significance at P < 0.05 (Tukey’s test).
