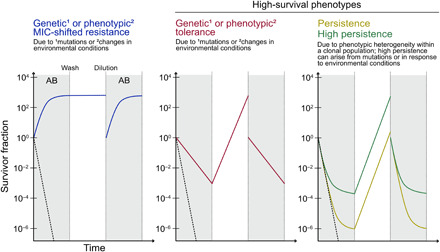
Fig. 1. Manifestations of antibiotic resistance.

Schematics show the survivor fraction over time upon exposure of a bacterial population to an antibiotic (AB; gray background), removal of the antibiotic (wash) and outgrowth (white background), and dilution to the original OD followed by reexposure to the same antibiotic. The killing kinetics for a completely susceptible population are depicted by dashed black lines.
