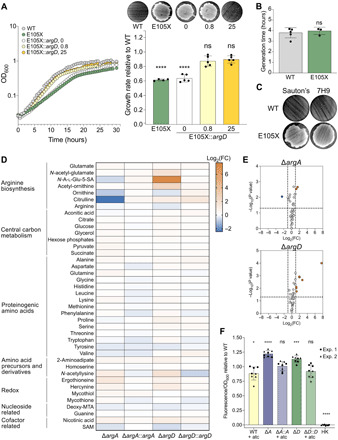
Fig. 4. HS upon exposure to kanamycin is not a consequence of slow growth or generally decreased metabolic activity.

ns, not significant; *P < 0.05; ***P < 0.001; ****P <0.0001. Error bars: ±SD. (A) ArgD-E105X with an atc-inducible copy of WT argD (E105X::argD) was grown in 0, 0.8, or 25 ng/ml of atc. Left: Growth curves. Symbols, mean OD600 of two to three replicates. Right: Growth rate relative to WT mean [bars, means of four to five replicate cultures (symbols) pooled from two independent experiments] and kanamycin survival (filters above bars). Generation times compared to WT by one-way analysis of variance (ANOVA). Growth curves and filters representative of two independent experiments. (B) Generation times of WT versus ArgD-E105X in Sauton’s (unpaired two-tailed t test). Bars, means of N independent experiments (symbols; N = 5 for WT and 3 for E105X) with three to four replicates each. (C) Kanamycin survival of WT and ArgD-E105X in Sauton’s. Representative of four to five independent experiments (E105X in Sauton’s, 4; WT in Sauton’s versus 7H9, 5). (D and E) Metabolites from ΔargA, ΔargA::argA, ΔargD, and ΔargD::argD provisionally identified by accurate mass and retention time. (D) Colors reflect mean log2 FC relative to WT from three independent experiments (three replicates each). N-A-l-Glu-5-SA, N-acetyl-l-glutamate-5-semialdehyde; deoxy-MTA, deoxy-methylthioadenosine; SAM, S-adenosylmethionine. (E) Mean log2 FC compared to a theoretical mean of 0 (two-tailed one-sample t test). Dotted lines, cutoffs (significance, P = 0.05; FC, ±2). (F) Strains from (D) were incubated with resazurin. Fluorescence (excitation 544 nm, emission 590 nm) was normalized to OD600 before addition of resazurin and then to WT mean. Bars, means of eight replicate cultures (symbols) pooled from two independent experiments (exp.). Means compared to a theoretical mean of 1 (two-tailed one-sample t test). HK, heat-killed. See also data S1.
