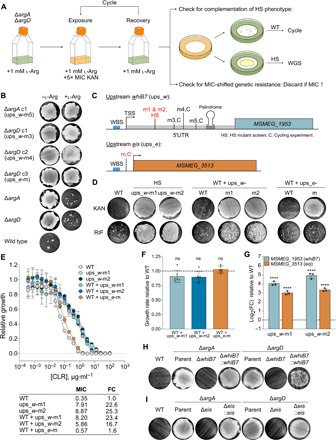
Fig. 6. Overexpression of whiB7 confers HS upon exposure to kanamycin or rifampicin and MIC-shifted resistance to CLR.

Error bars: ±SD. (A) Cycling experiment (see main text). l-Arg, l-arginine. KAN, kanamycin. WGS, whole-genome sequencing. (B) KAN survival of mutants from (A) grown ± provision of 1 mM l-Arg. (C) Schematics of whiB7 (MSMEG_1953) and eis (MSMEG_3513) showing mutants in (B) and two HS mutants (red; used in subsequent experiments). TSS, transcription start site. WBS, WhiB7 binding site. (D) KAN or rifampicin (RIF) survival of ups_w-m1 and ups_w-m2 mutants and WT containing 485 bp upstream + MSMEG_1953 from WT, ups_w-m1, or ups_w-m2 or 236 bp upstream + MSMEG_3513 from WT or ups_e-m. Representative of two to eight independent experiments (KAN, RIF; ups_w-m: 8, 4; ups_w-m2: 6, 3; WT + ups_w-wt: 3, 2; ups_w-m1: 5, 2; ups_w-m2: 3, 2; ups_e-wt: 3, 2; ups_e-m: 4, 2). (E) CLR MIC (μg·ml−1) for strains in (D). Growth relative to no-antibiotic control. Values calculated as described in Materials and Methods. FC relative to WT. Symbols, means of three replicates. Representative of two independent experiments. (F) Growth rates relative to WT of WT + ups_w-m1, ups_w-m2, and ups_e-m. Bars, means of six independent experiments (symbols) with three to five replicates each. Generation times compared to WT (one-way ANOVA). (G) whiB7 and eis transcript levels in ups_w-m1 and ups_w-m2 mutants. Bars, mean log2 FC relative to WT of three replicates (symbols). ΔCp values compared to WT ΔCp (one-way ANOVA). ****P < 0.0001. Representative of two independent experiments. (H and I) KAN survival of ΔargAΔwhiB7, ΔargAΔeis, ΔargDΔwhiB7, and ΔargDΔeis complemented with the ups_e-WT construct in (C) or a longer ups_w-WT construct containing 800 bp upstream of whiB7. Representative of three to seven independent experiments (ΔwhiB7: ΔargA, 7; ΔargD, 4; Δeis: 4). See also fig. S5 and table S2.
