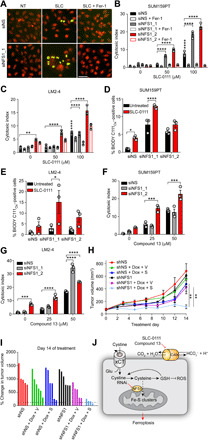
Fig. 3. NFS1 suppression combined with CAIX/XII inhibitors triggers ferroptosis.

(A to C) Cell viability data of the indicated cell lines following NFS1 depletion in combination with SLC-0111 in the presence or absence of Fer-1 (2 μM) for 72 hours in hypoxia. (A) Representative IncuCyte images of the indicated treatments. Green, cytotoxicity; red, nuclei. (B and C) Quantitation of IncuCyte data for the indicated cell lines treated and cultured in hypoxia for 72 hours. (D and E) Lipid peroxidation (BODIPY C11Ox fluorescence) of the indicated cell lines treated as in (B) and (C) by flow cytometry. (F and G) Cell viability of the indicated cell lines following NFS1 depletion and treatment with compound 13 for 72 hours in hypoxia. (H) Tumor growth curve of orthotopic SUM159PT control (shNS) or NFS1-depleted (shNFS1) tumors treated with vehicle or SLC-0111 following induction of shRNA with Dox. n = 4 to 6 per group. V, vehicle; S, SLC-0111. (I) Waterfall plot depicting percent change in individual tumor volume of the groups color coded as in (H) following 14 days of treatment. (J) Model depicting CAIX inhibition combined with NFS1 depletion triggering ferroptosis. Bars represent means ± SEM (B to H). *P < 0.05, **P < 0.01, ***P < 0.001, and ****P < 0.0001. Statistical significance was assessed using two-way ANOVA followed by Tukey’s multiple comparison test post hoc (B to G) or by ANOVA followed by Bonferroni correction (H). Shown are representative data from experiments performed at least twice. Scale bar, 50 μm.
