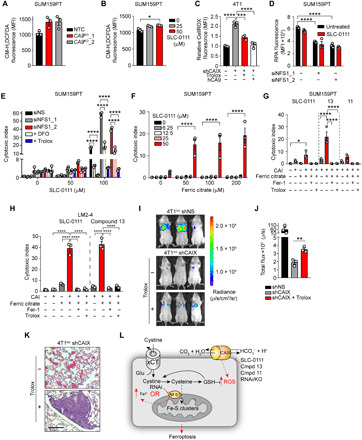
Fig. 4. CAIX suppresses ROS production.

Cellular ROS levels in hypoxic SUM159PT CA9KO (A) SLC-0111–treated (B) and CAIX-depleted 4T1luc cells (C) following 72 hours of exposure to hypoxia detected with CM-H2DCFDA (A and B) and CellROX Deep Red (C). (D) Mitochondrial iron (RPA fluorescence) levels in hypoxic NFS1-depleted SUM159PT cells treated with SLC-0111 for 72 hours in hypoxia. (E) Cell viability of SUM159PT cells treated with NFS1 siRNA and the indicated concentrations of SLC-0111 in the presence or absence of deferoxamine (DFO; 10 μM) or Trolox (100 μM) for 72 hours in hypoxia. (F) Cell viability of SUM159PT cells treated with the indicated concentrations of ferric citrate in combination with SLC-0111 for 72 hours in hypoxia. (G) Cell viability of SUM159PT or (H) LM2-4 cells treated with ferric citrate together with SLC-0111, compound 13 (13), or compound 11 (11) in the presence or absence of Fer-1 (2 μM) or Trolox (100 μM) for 72 hours in hypoxia. CAI, carbonic anhydrase inhibitor. (I) Bioluminescent images depicting metastatic burden of intravenously injected 4T1luc shNS, 4T1luc shCAIX, and 4T1luc shCAIX cells pretreated with Trolox. n = 3 per group. (J) Quantitation of total chest bioluminescence of the groups in (H). (K) Representative hematoxylin and eosin–stained lung sections from shCAIX groups in (H). Scale bar, 200 μm. (L) Model depicting increased ROS resulting from CAIX/XII inhibition inducing vulnerability to perturbations in iron levels. Bars represent means ± SEM. Shown are representative experiments from experiments performed at least twice. *P < 0.05, **P < 0.01, and ****P < 0.0001. Statistical significance was assessed using one-way (B, C, G, and H) or two-way (D to F) ANOVA followed by Tukey’s multiple comparisons test post hoc or by t test (I).
