
Figure 4.
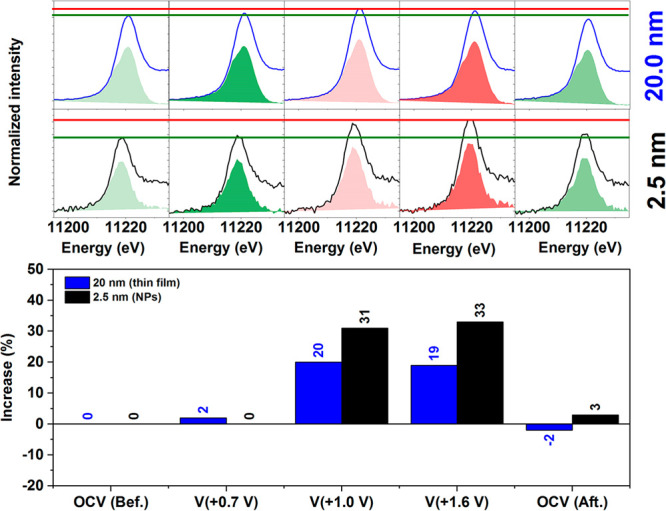
Top: Spectra at different potential for the thin-film IrOx electrode (20 nm) and free-standing CVD bilayered graphene (BLG) electrode decorated with IrOx 2.5 nm NPs (top). Bottom: Relative increase of the hole density against the electrode potential recorded during the in situ characterization.