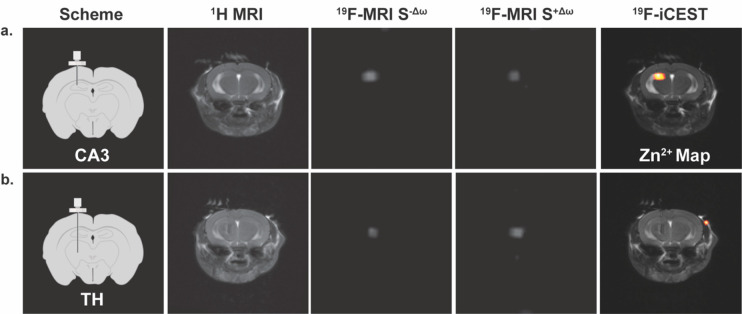
Figure 5.
In vivo19F-iCEST maps of labile Zn2+ pools in the mouse brain. Shown results for two regions of the brain: (a) CA3 in the hippocampus (zinc-rich ROI) or (b) the thalamus (TH, zinc-poor ROI). From left-to-right are the schematic illustration of the setup used to deliver 5 to either CA3 or TH, the1H-MRI, the19F-MRI S–Δω (presaturation pulse applied at Δω = −3.2 ppm, i.e., “off-resonance”), the 19F-MRI S+Δω (presaturation pulse applied at Δω = +3.2 ppm, i.e., “on-resonance”), and the 19F-iCEST contrast (Zn2+ map) obtained from subtracting 19F-MRI S+Δω from 19F-MRI S–Δω overlaid on the 1H-MRI. MRI scans were performed at 15.2 T. Infusion rate was set to 0.25 μL/min (of 10 mM 5 in PBS), and iCEST data acquisition started 90 min from the onset of the infusion of 5.

