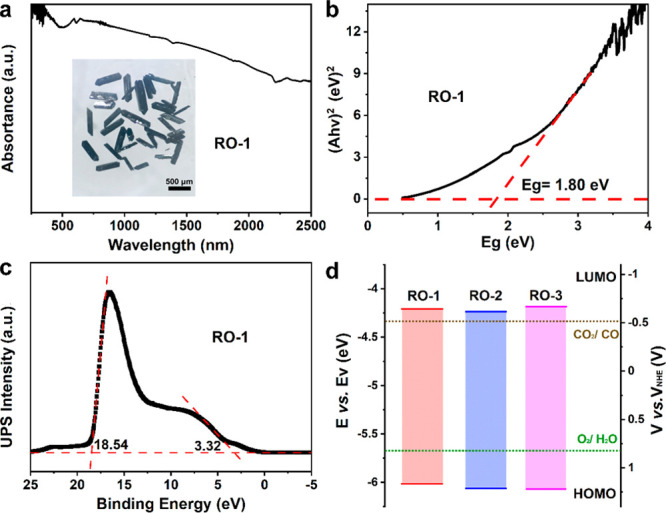
Figure 2.

Optical characterizations of photocatalysts. (a) UV–vis–NIR absorption spectrum of RO-1. (inset) Photograph of RO-1 under an optical microscope. (b) Band gap energy (Eg) analysis of RO-1. The intersection of the baseline and the slant dashed line is the band gap. (c) UPS spectrum of RO-1. (d) Energy bandgap diagrams of RO-1, 2, and 3 with respect to the CO2RR and WOR potentials (pH = 7). The electron volts (eV, left y axis) are converted to electrochemical energy potentials in volts (V, right y axis) according to which 0 V vs RHE (reversible hydrogen electrode) equals −4.44 eV vs evac (vacuum level). Then, the RHE potentials are further converted to NHE (pH = 7) according to E (vs NHE, pH = 7) = E (vs RHE) – 0.0591 × 7.
