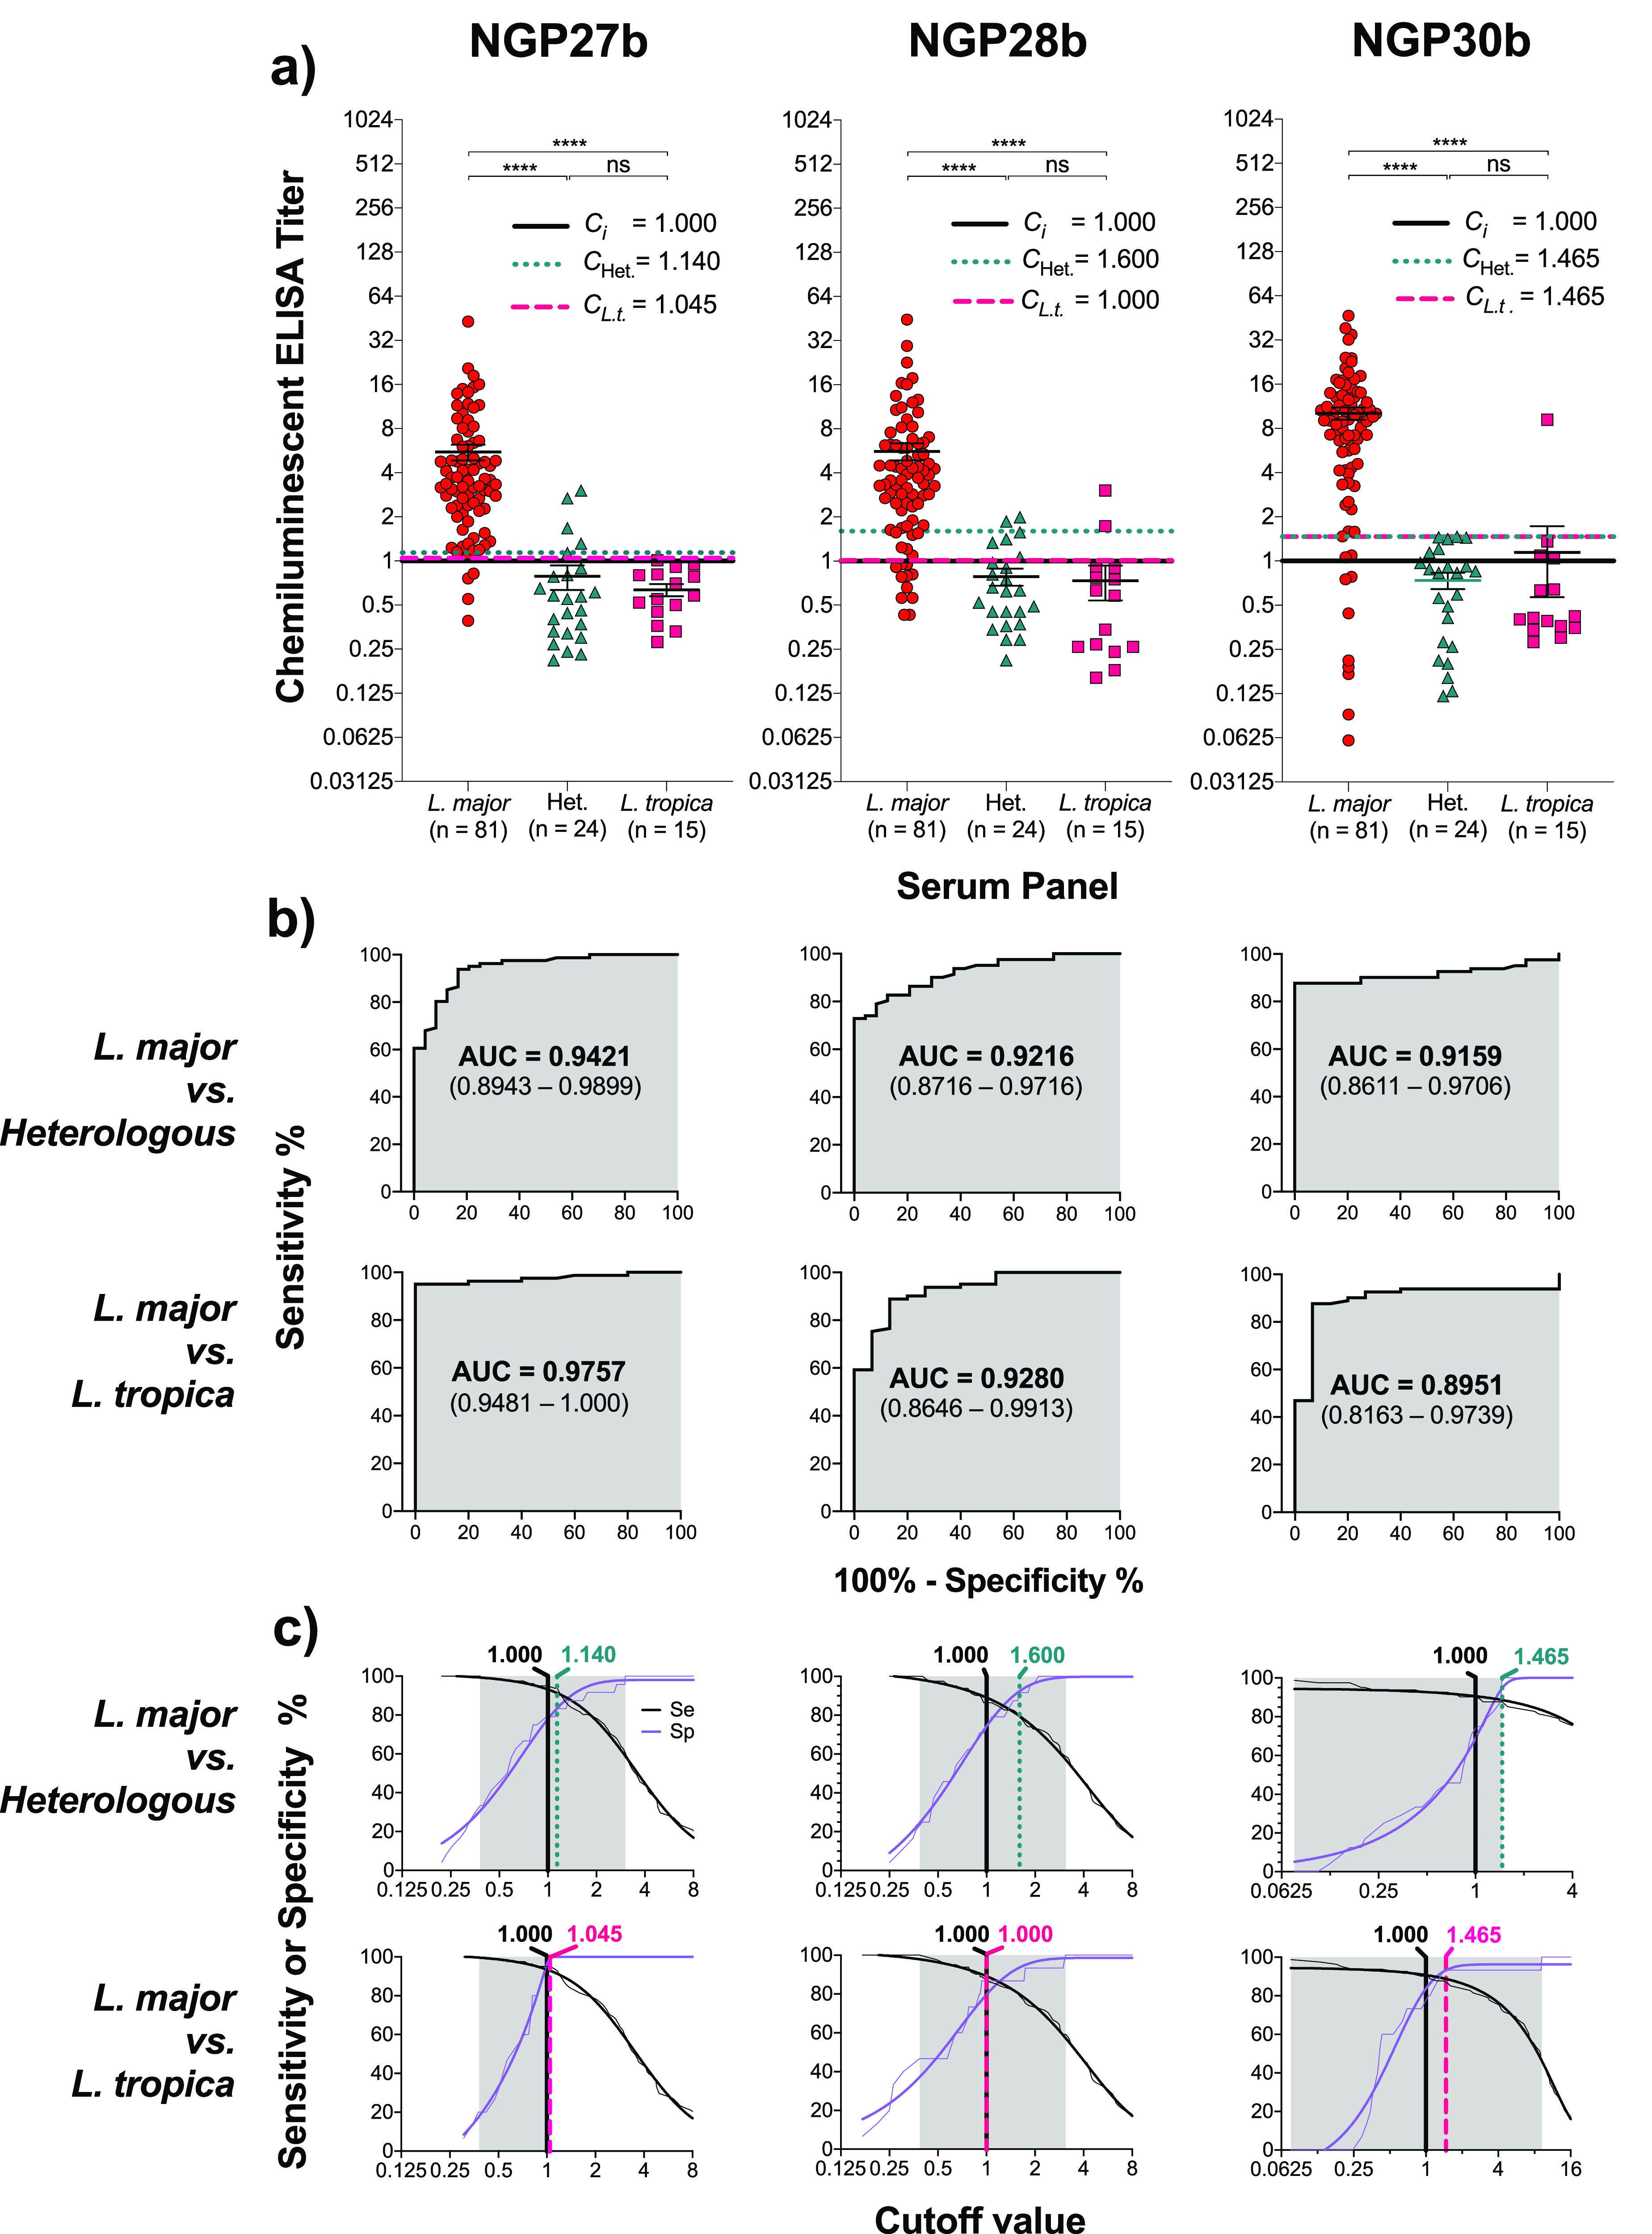
Figure 2.

Chemiluminescent ELISA reactivity of NGP27b, NGP28b, and NGP30b with sera from individual patients with L. major or L. tropica infection or with heterologous disease. Sera (at 1:800 dilution) from individual patients with active L. major or L. tropica infection or with heterologous disease (with other skin conditions) were evaluated against NGP27b, NGP28b, and NGP30b, each at 25 ng/well. Chemiluminescent ELISA was performed as described in the Supporting Information (“Chemiluminescent ELISA”). (a) Grouped scatter plot analysis of sera from L. major or L. tropica infections or heterologous diseases (Het.) with NGP27b, NGP28b, or NGP30b. The Y-axis values are in log2 scale. Ci, initial cutoff value (titer = 1.000), calculated as described in the Supporting Information. CL.t., adjusted cutoff value, calculated based on the ROC and TG-ROC curve analysis data (b, c), for the comparison between sera from L. major vs L. tropica infections. CHet., adjusted cutoff value for the comparison between sera from L. major infection vs heterologous diseases. Statistical analysis: nonparametric Mann–Whitney test. Significance level: p < 0.05. ****, p < 0.0001; ns, nonsignificant. (b) Receiver-operating characteristic (ROC) curves for NGP27b, NGP28b, and NGP30b, comparing the reactivity of sera from L. major vs L. tropica infections (top row) or sera from L. major infections vs heterologous diseases (bottom row), using the data depicted in the scatter plots (a). AUC, area under the curve, is indicated (gray area). In parentheses, 95% confidence interval values are indicated. (c) A TG-ROC curve analysis was performed by plotting the ROC data (b) for sensitivity (Se) and specificity (Sp), as described by Greiner et al.64 Shaded area indicates the cutoff value interval where Se or Sp could reach 100%. The Se (black) and Sp (purple) raw data points are represented as fine lines, whereas the fitted data are indicated as thick lines. Vertical black line, original titer cutoff value (Ci = 1.000); vertical dotted green line, adjusted cutoff value for the comparison of L. major infections vs heterologous diseases; vertical dashed red line, adjusted cutoff value for the comparison of L. major vs L. tropica infections. The adjusted cutoff values are indicated in green or red.
