
Fig. 2.
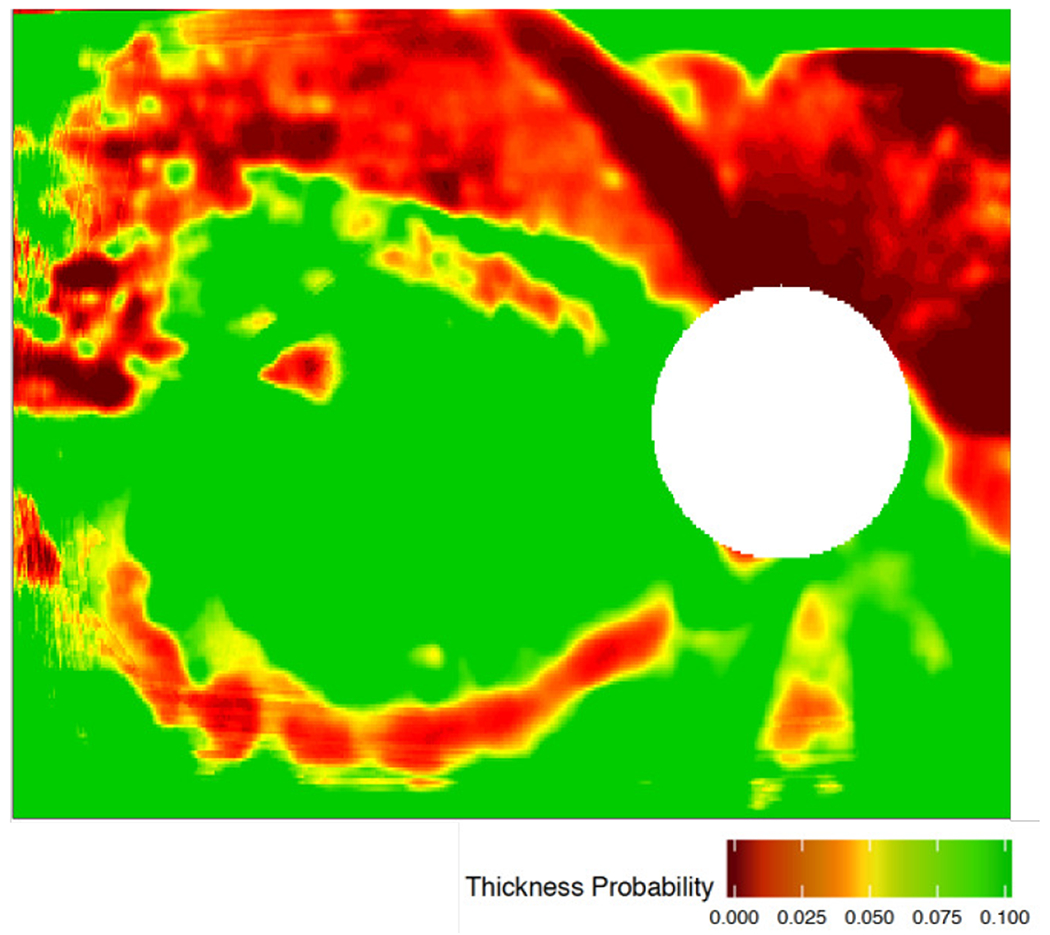
Sample OCT retinal nerve fiber layer (RNFL) image of a patient’s right eye (OD) with glaucoma. Green-to-red color spectrum indicates increasing spatial probability of retinal tissue degeneration compared to age-matched and gender-matched healthy population (i.e. green indicates normal/healthy tissue regions, while yellow and red indicate abnormal/potentially diseased tissue regions). White circle in image represents location of the optic nerve, where ganglion cell axons converge, so there is limited retinal tissue in that region.