
Fig. 7.
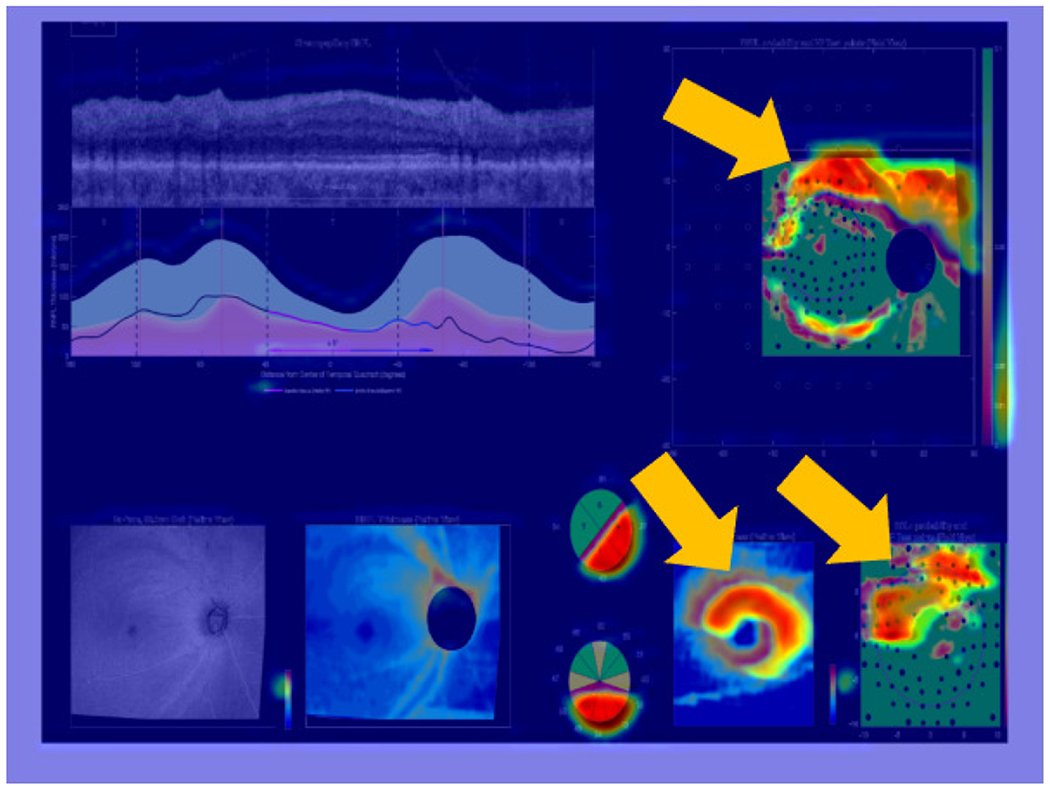
Grad-CAM overlayed on full OCT report, showing regions contributing most to CNN classification decision via warm (red/yellow) colors. These regions, on RNFL and RGCP probability maps as well as on the RGCP thickness map specifically, are also indicated with golden arrows for easy localization.