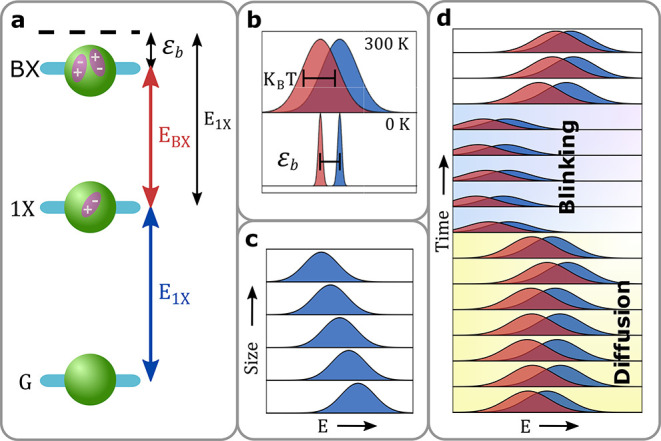
Figure 1.

Obstacles in measuring the 1X–BX energy ladder. (a) The energy diagram of the 1X and BX states in a nanoparticle. The energy difference between the BX and 1X states (EBX) is smaller than the difference between the 1X and ground states (E1X) by the biexciton binding energy (εb). (b) Schematic of the thermal broadening of spectral lines (intensity normalized for clarity). At room temperature, the 1X-ground (blue) and BX–1X (red) transitions emission lines are broadened to approximately ∼kBT ≈ 26 mev > εb. As a result, the two emission spectra substantially overlap. (c) Schematic dependence of the 1X energy on nanoparticle size. An ensemble measurement (with a ± 5% size variance) at room temperature roughly includes a mixture of the depicted spectra. (d) Scheme of spectral drift in the emission lines of a single nanocrystal throughout the measurement time. Apart from the stochastic random walk of the spectral lines (diffusion), discrete spectral jumps typically accompany blinking events.
