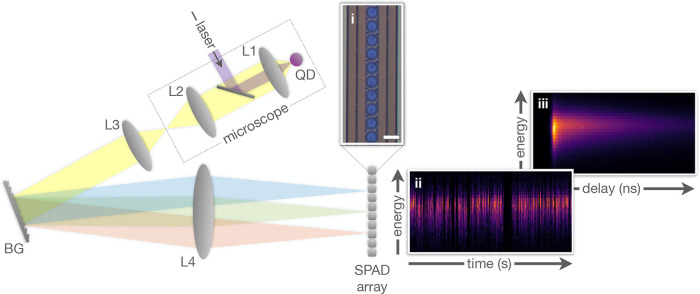
Figure 2.
Sketch of the spectroSPAD experimental apparatus. A microscope objective is used to focus a pulsed laser beam on a single QD and collect the emitted fluorescence. At the microscope output, light is passed through a spectrometer setup with a linear SPAD array detector. Inset (i) is an optical image of part of the detector array. Each blue circle represents a single pixel. Scale bar is 30 μm. Insets (ii) and (iii) show two possible analyses of a single nanocrystal spectroSPAD measurement. In (ii), detections are binned according to detection time in the millisecond scale (horizontal) and photon energy (vertical); whereas in (iii) the horizontal axis represents the detection temporal delay from the preceding excitation laser pulse in nanosecond scale. Color-scale corresponds to the number of counts in each temporal-energy bin. Optical elements: objective (L1), tube (L2), collimating (L3), and imaging (L4) lenses; blazed grating (BG).

