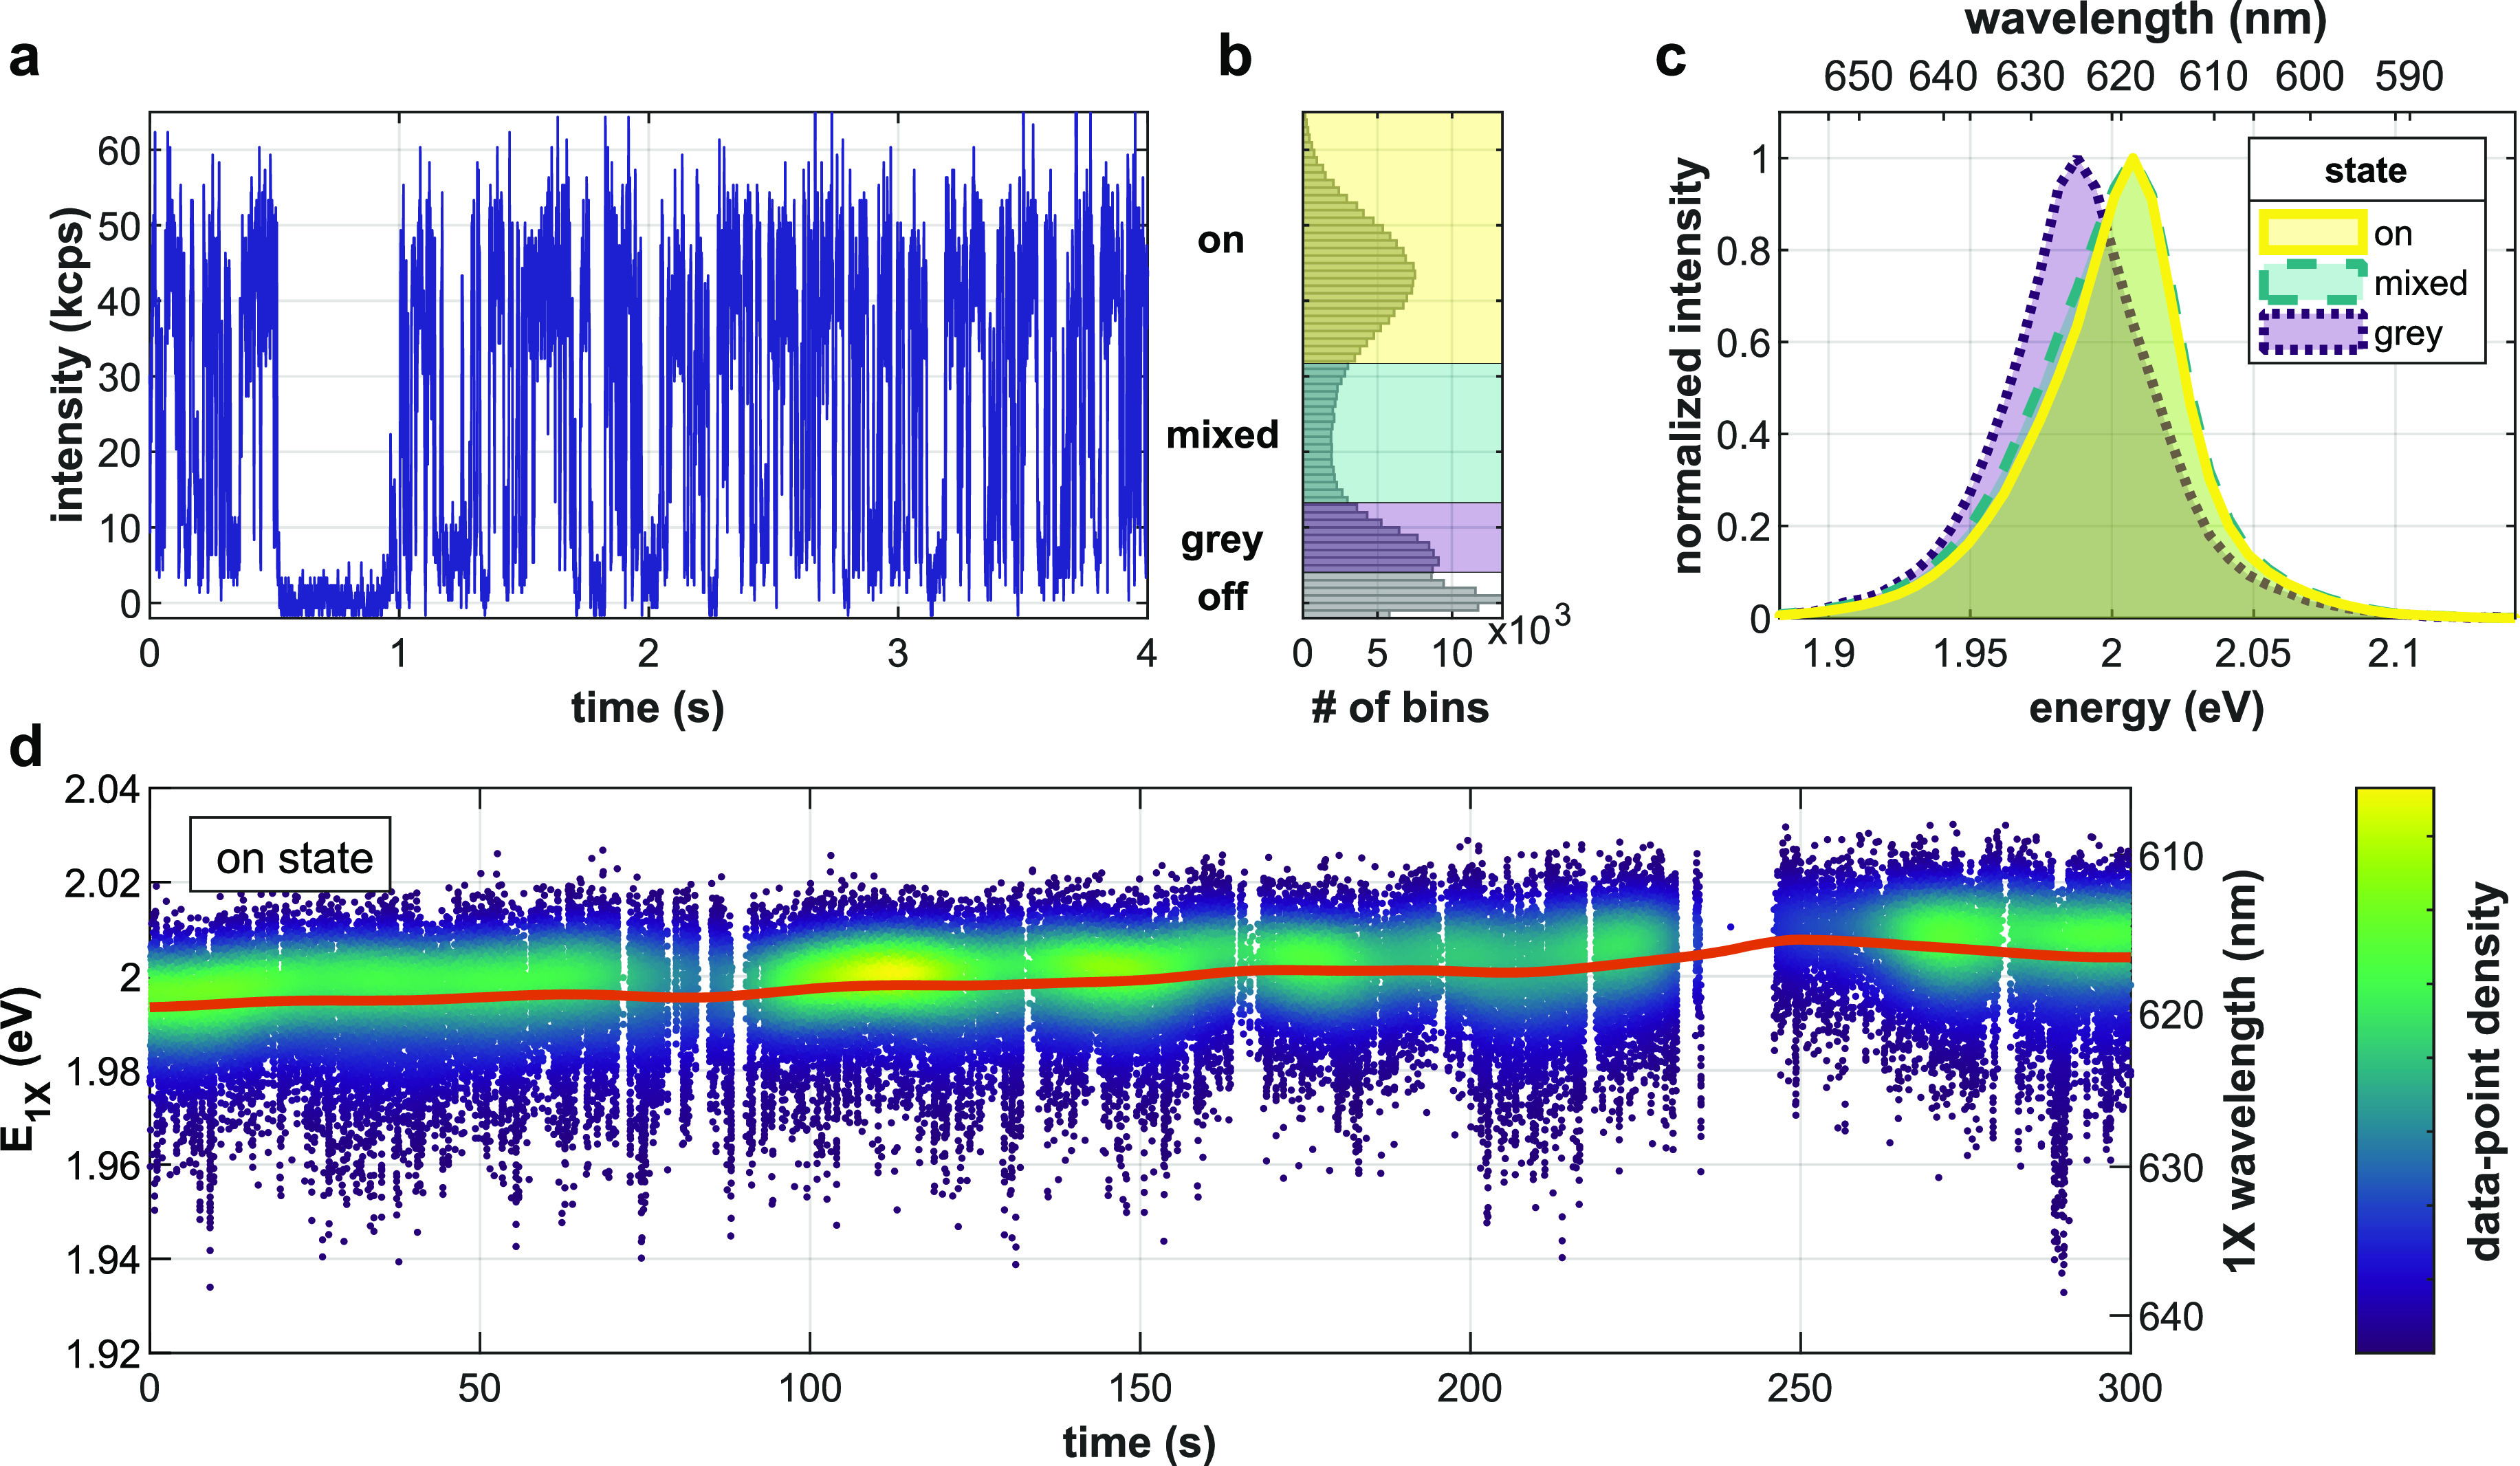
Figure 3.

Spectral dynamics of a single QD. (a) Total detected fluorescence intensity, collected over all pixels, versus time in a 4 s period (1 ms time-bins). (b) Histogram of intensity values over a 5 min measurement. Intensity states are marked by colored shading: “off”, “gray”, “mixed”, and “on”. (c) Spectrum according to intensity gating. Note the gray state’s red-shift with respect to the on state. (d) The on state spectral peak evolution over time. Each point is the momentary mean photon energy for a 1 ms time-bin of the on state (⟨E⟩1ms), colored according to the local density of data-points for clarity. The red line, ⟨E⟩10s, presents a moving Gaussian-weighted average (σ = 10 s).
