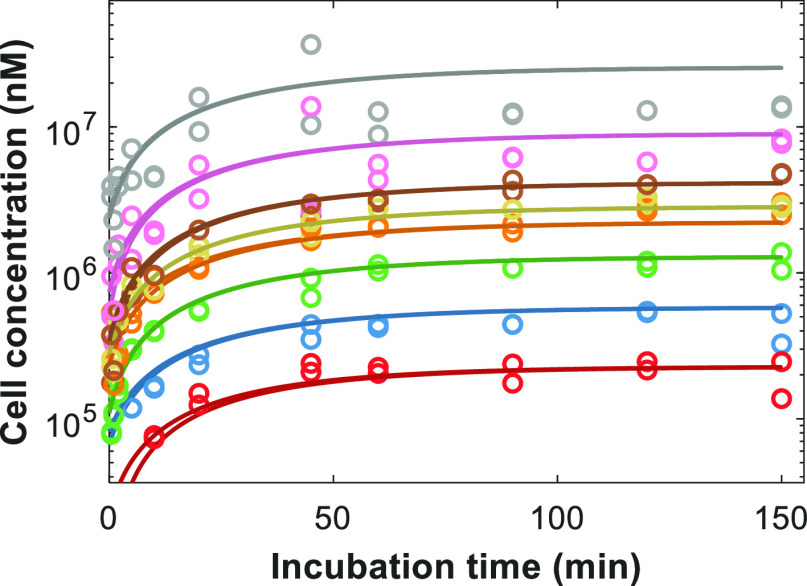
Figure 3.
Representative example of fitting of mechanistic hepatocyte model to in vitro gadoxetate uptake data in plated rat hepatocytes from a single animal, with each nominal concentration run in duplicate. Colored lines and symbols represent simulated and observed data for experiments performed with nominal initial media concentrations of 10 μM (red), 30 μM (blue), 100 μM (green), 300 μM (orange), 500 μM (gold), 1 mM (brown), 3 mM (pink), and 10 mM (gray), respectively.

