Figure 1.
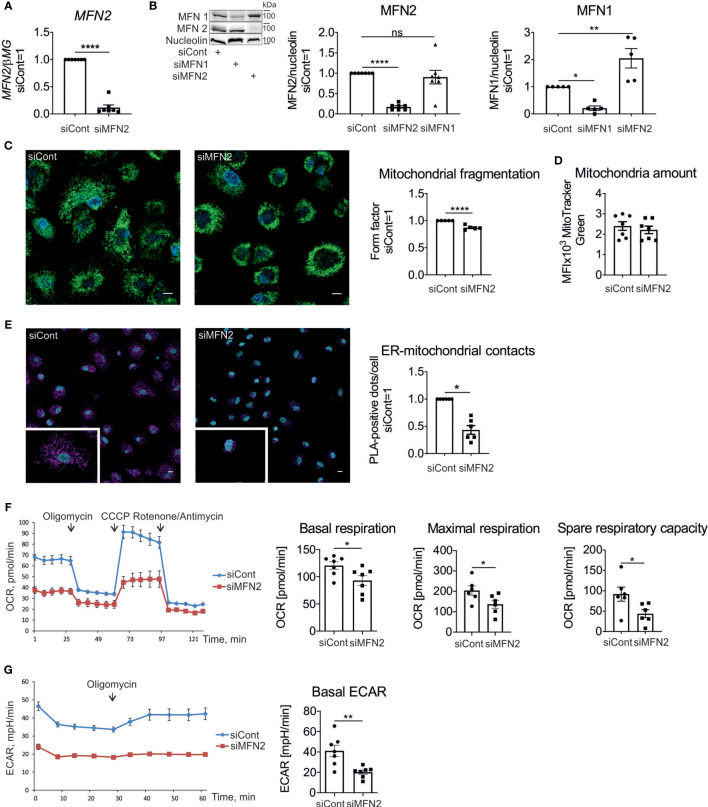
Characterization of mitochondria in MFN2-silenced human macrophages. (A) MFN2 mRNA expression in human primary macrophages transfected with non-targeting control siRNA (siCont) or MFN2 siRNA (siMFN2). (B) Western blot analysis and quantification of MFN2 and MFN1 proteins in macrophages transfected with control (siCont), MFN2 (siMFN2), and MFN1 (siMFN1) siRNAs. (C) Representative images of macrophages transfected with siCont or siMFN2 and stained with MitoTracker Green (mitochondria) and Hoechst (nuclei). Quantification of the mitochondrial fragmentation using form factor parameter. Scale bars = 10 μm. (D) Total amount of mitochondria calculated by staining with MitoTracker Green. (E) Representative images of the interactions between VDAC1 and IP3R1 (pink dots) analyzed by proximity ligation assay in macrophages transfected with siCont or siMFN2. Nuclei are stained with DAPI (blue). Scale bars = 10 μm. The number of VDAC1/IP3R1 interactions (ER-mitochondrial contacts) per cell was analyzed using Image J software. (F) Seahorse profile of oxygen consumption rates (OCR) in macrophages transfected with siCont or siMFN2 following treatments with oligomycin, CCCP, rotenone, and antimycin. Bar charts showing basal respiration, maximal respiration, and spare respiratory capacity of control and MFN2-silenced macrophages. (G) Extracellular acidification rate (ECAR) under basal conditions and after the addition of oligomycin. All results are shown as means ± SEM of at least three independent experiments compared using one-way analysis of variance (ANOVA) with Dunnet’s multiple comparisons test or Student unpaired, two-tailed t-test; *p < 0.05; **p < 0.01; ****p < 0.0001; ns , not significant. Photographs are representative of five (C) and six (E) independent experiments.

