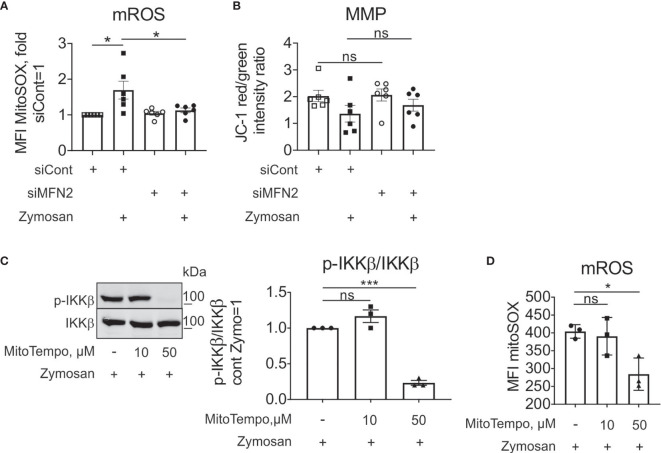
Figure 5.
MFN2 impact on zymosan-stimulated signaling is mROS-independent. (A) mROS production in control and MFN2-silenced macrophages was measured by MitoSOX staining. Cells were treated with 50 µg/ml zymosan for 30 min. (B) Mitochondrial membrane potential (MMP) in control and MFN2-silenced macrophages was measured by JC-1 staining. Cells were treated with 50 µg/ml zymosan for 30 min. (C) Western blot analysis and quantification of IKKβ phosphorylation in macrophages pre-incubated for 30 min with mROS inhibitor MitoTEMPO (10 or 50 µM) followed by zymosan (50 µg/ml) stimulation for 30 min. (D) mROS production in macrophages pre-incubated for 30 min with MitoTEMPO (10 or 50 µM) prior to zymosan (50 µg/ml) stimulation for 30 min. All results are shown as means ± SEM of at least three independent experiments compared using one-way analysis of variance (ANOVA) with Sidak’s multiple comparisons test; *p < 0.05; ***p < 0.001; ns, not significant.

