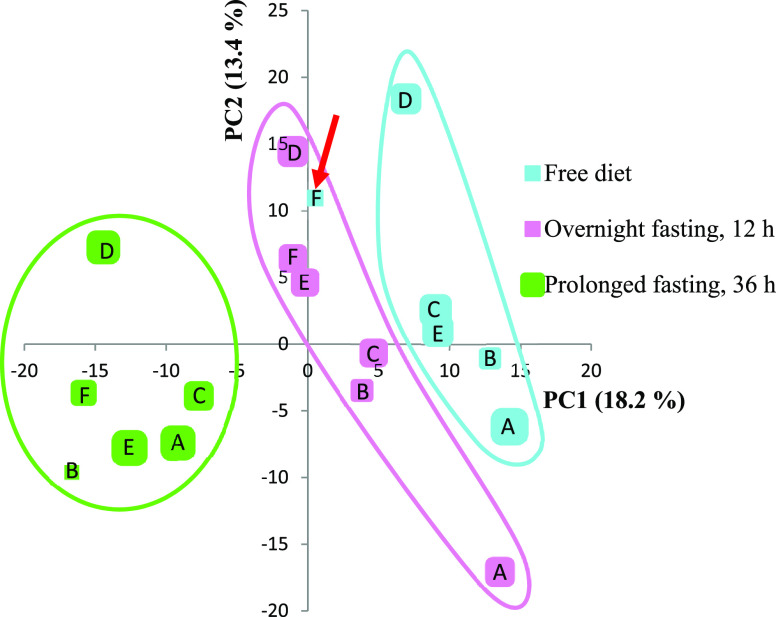
Figure 10.
Principal component analysis plot of DBS samples from six individuals (A–F) taken after free diet, overnight fasting (12 h), and prolonged fasting (36 h). One point represents metabolites detected in that particular sample. Individual F did not eat before collecting the free diet sample. This point (red arrow) thus clustered correctly together with the overnight fasting samples.

