
Figure 2.
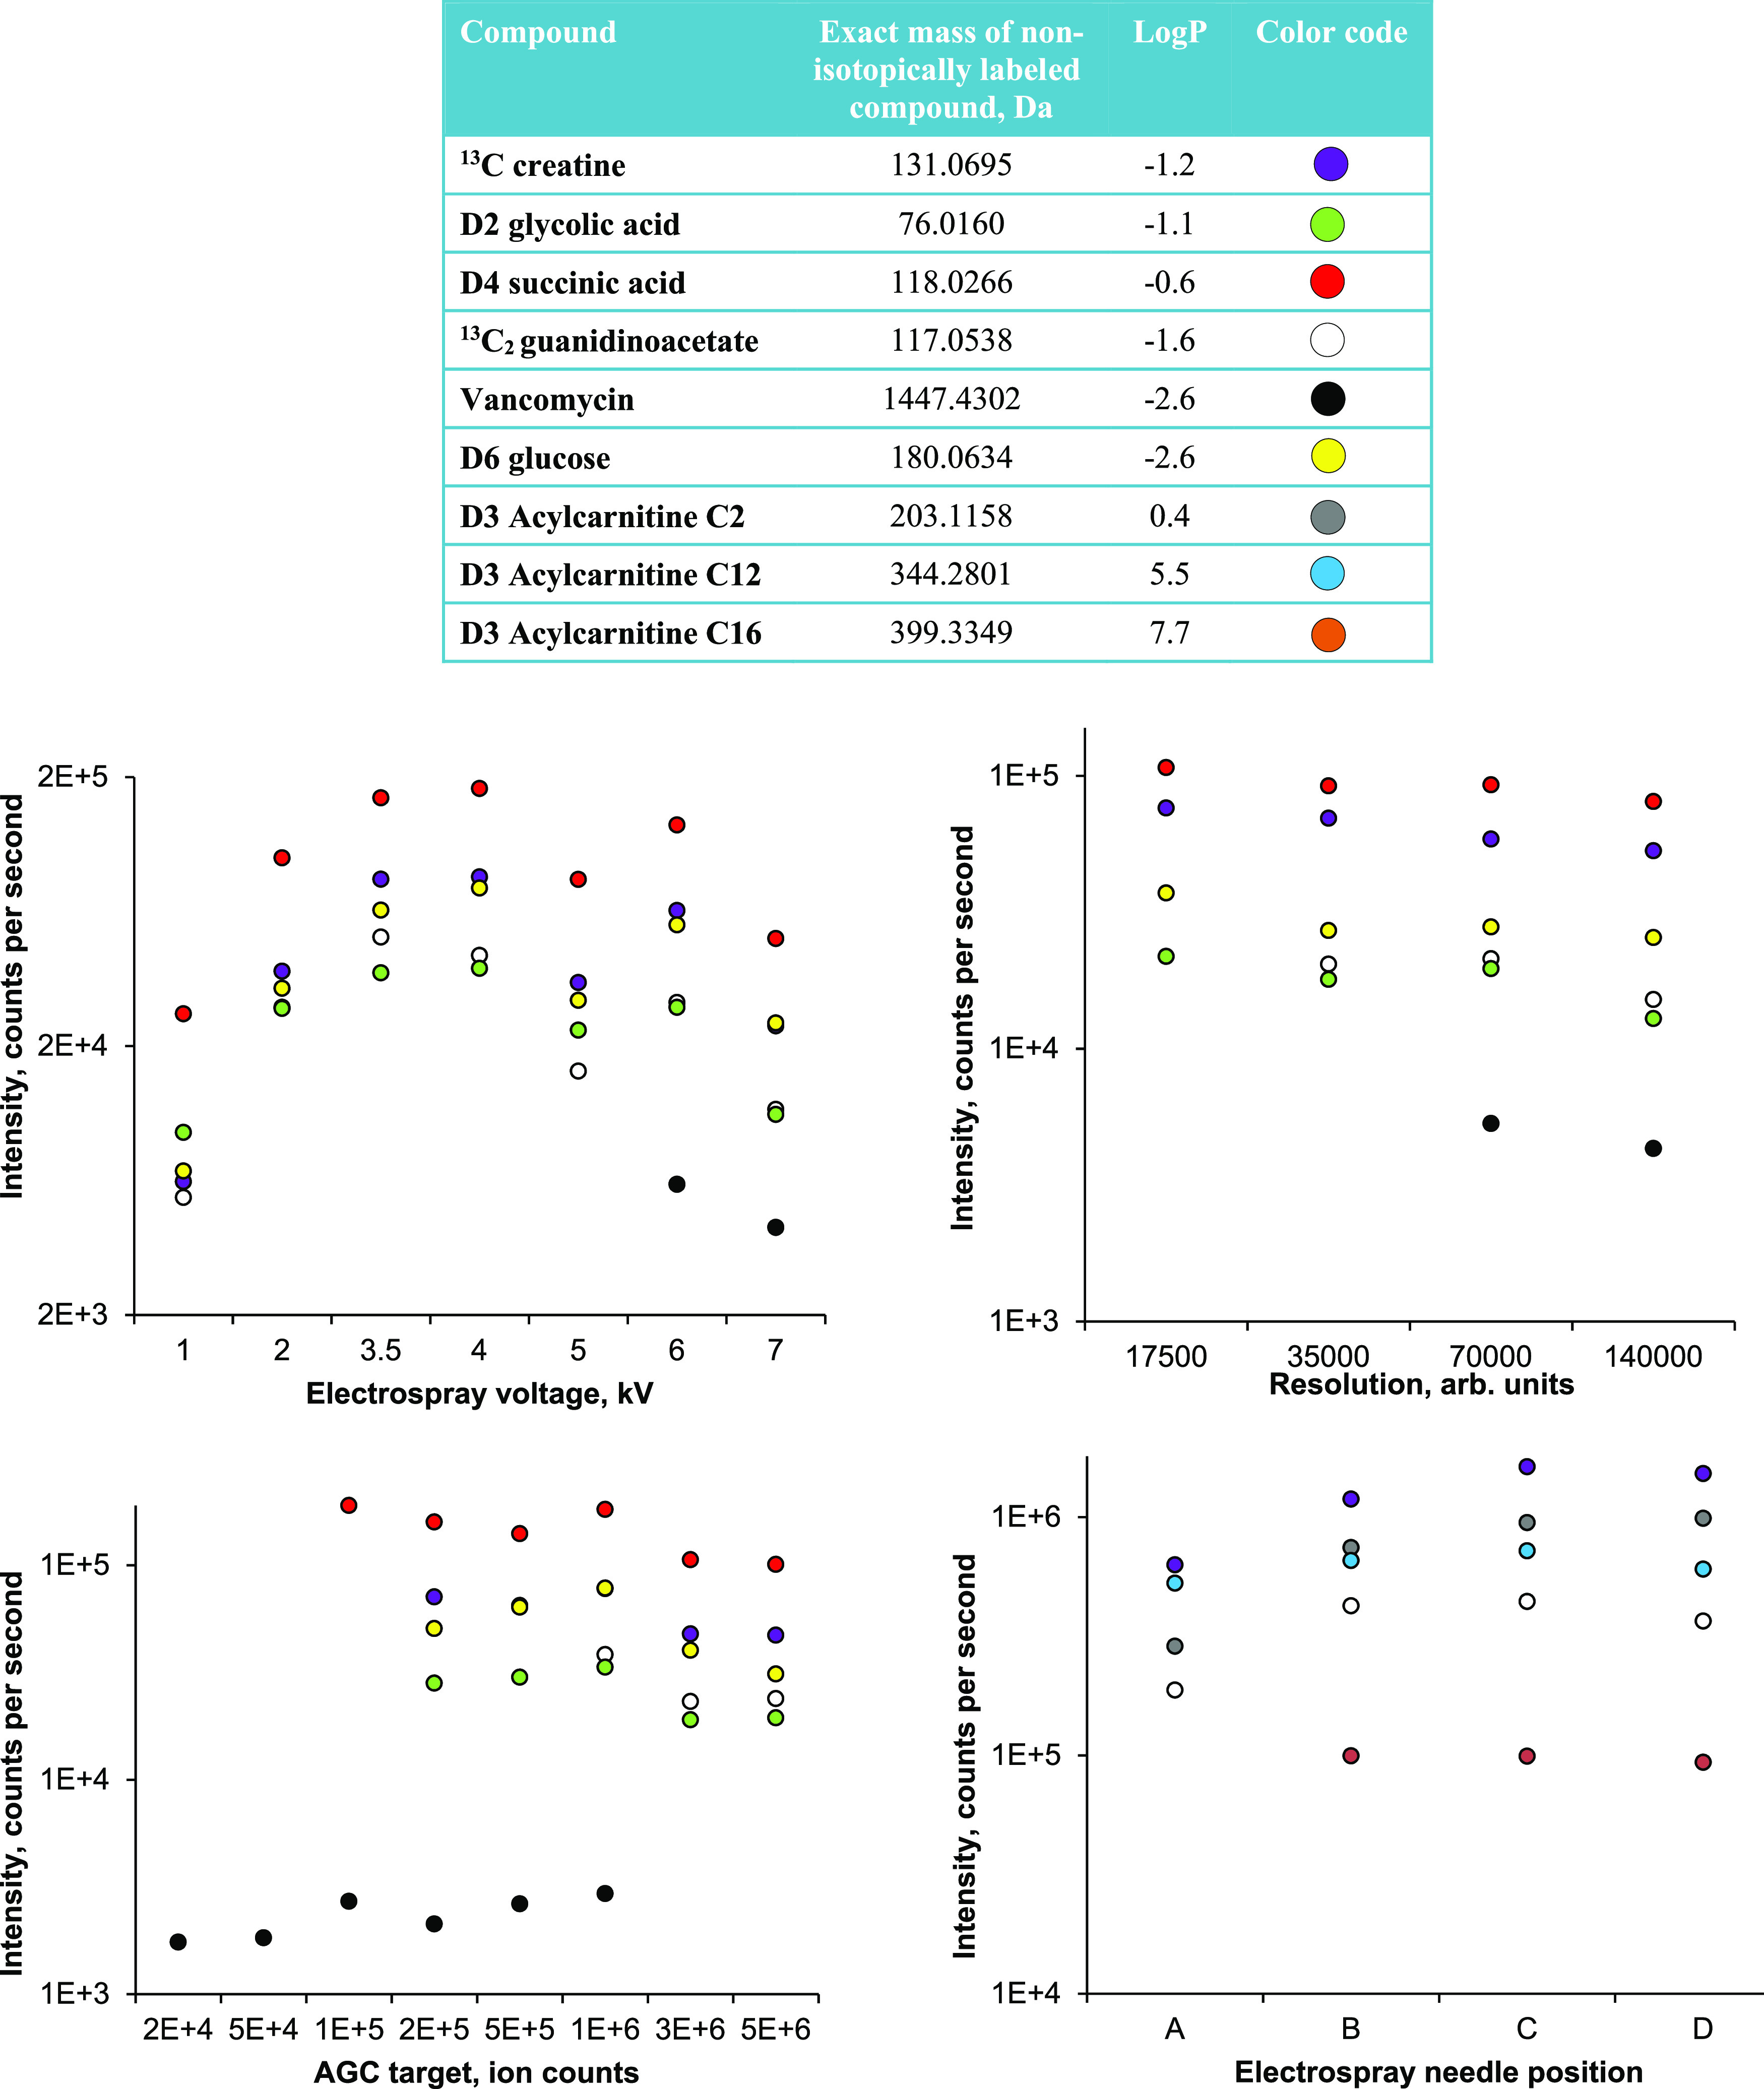
Top: exact mass and log P values of compounds used for MS optimization experiments. Exact mass and log P values were found at Pubchem.27 Colored dots show the color of each compound in the plots. Bottom: peak intensity with tested settings.