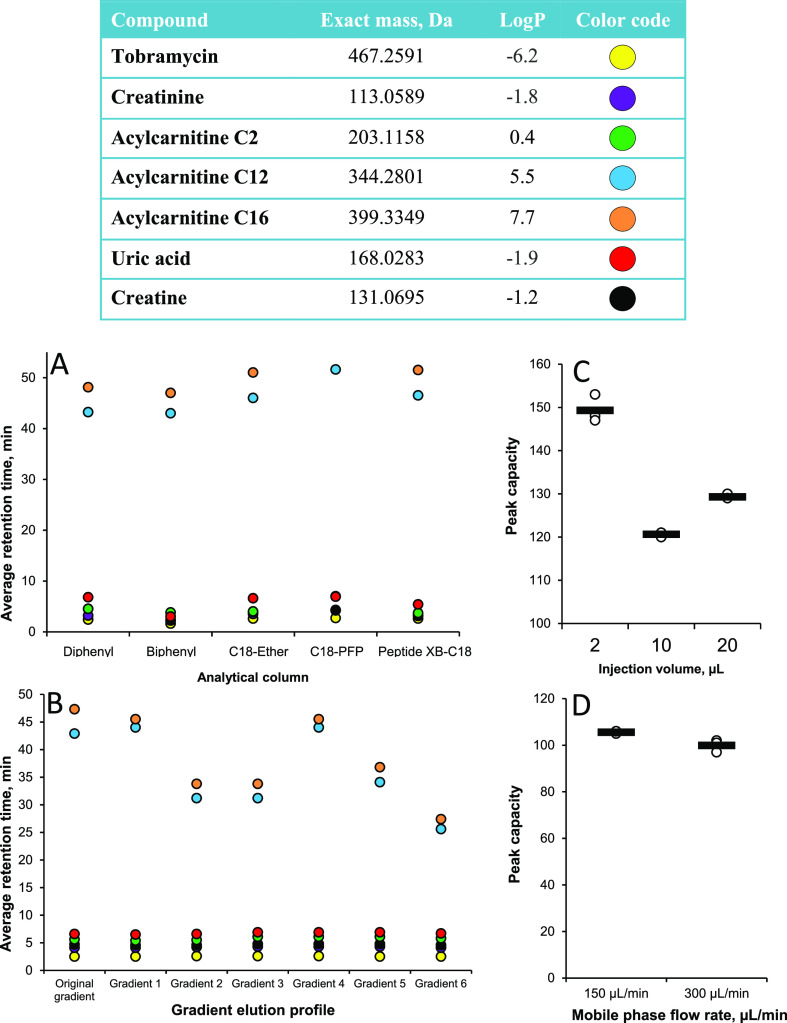
Figure 3.
Top: exact mass and log P values of compounds used for LC optimization experiments. Exact mass and log P values were found at Pubchem.27 Colored dots show the color of each compound in the plots. Bottom: average retention time (n = 3) of compounds for tested columns (A). All columns tested provided sharp chromatographic peaks (see the Supporting Information, Figures S1–S4), but the diphenyl SP variant was interpreted as having a modestly best selectivity for polar compounds (0–10 min area). (B) Retention times for gradient elution profiles using the diphenyl SP, with gradient 6 arguably preserving selectivity at a shorter analysis time. Average peak capacity (n = 3) for tested injection volumes (C) and tested mobile phase flow rates (D).

