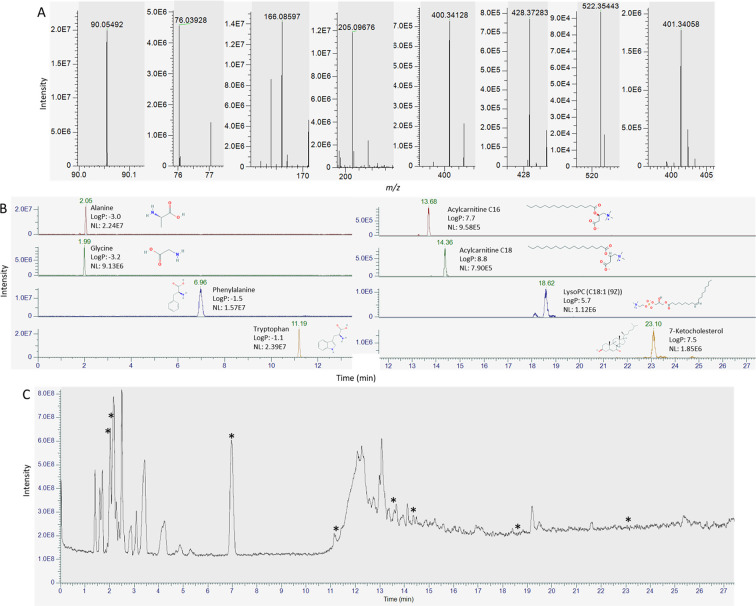
Figure 8.
Mass spectra (A) and extracted ion chromatograms with names, log P values, signal intensities, and structures (B) of a selection of detected endogenous compounds in a dried blood spot (alanine, glycine, phenylalanine, tryptophan, acylcarnitine C16, acylcarnitine C18, LysoPC (C18:1 (9Z)), and 7-ketocholesterol), and total ion chromatogram (C) with asterisks indicating at which points in the chromatogram the spectra in panel (A) are located. Log P values and structures were obtained from Pubchem.27

