
FIGURE 6.
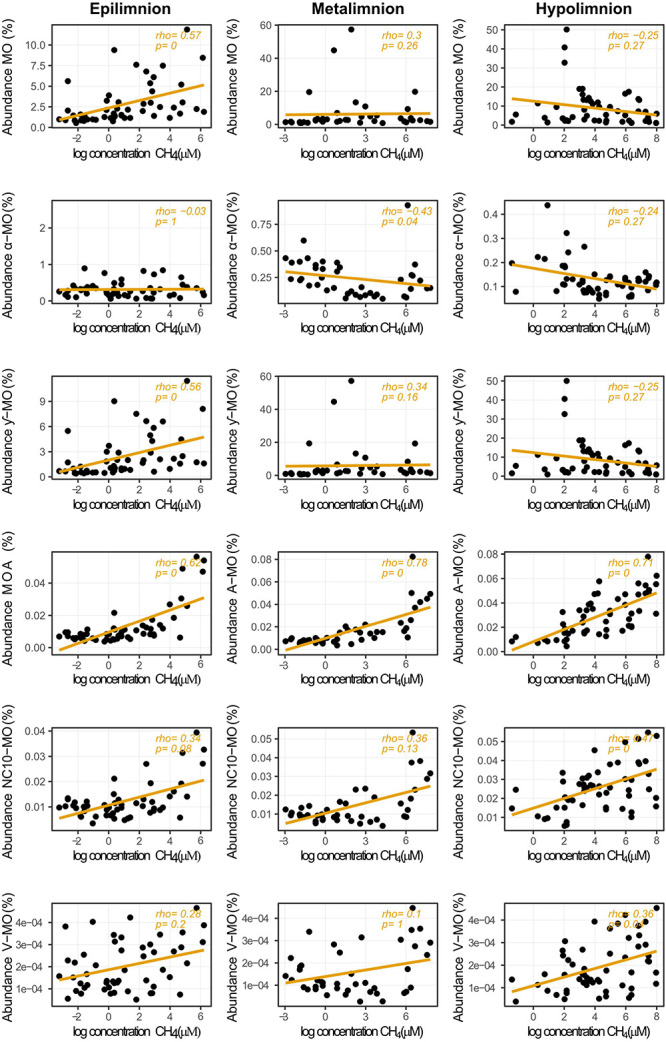
Relationship between relative abundances of methane oxidizers and CH4 concentrations in the different layers of stratified lakes. The taxa represented are alphaproteobacterial methanotrophs (α-MO), gammaproteobacterial methanotrophs (ƴ), Archaea (MOA), bacterial phylum NC10 (NC10-MO), Verrucomicrobial methanotrophs (V-MO), and the sum of all methane oxidizers (MO). Rho indicates Spearman’s rank correlation coefficients. p-values were adjusted with the Bonferroni method and rounded to two digits. Null p-values indicate p ≤ 0.005.