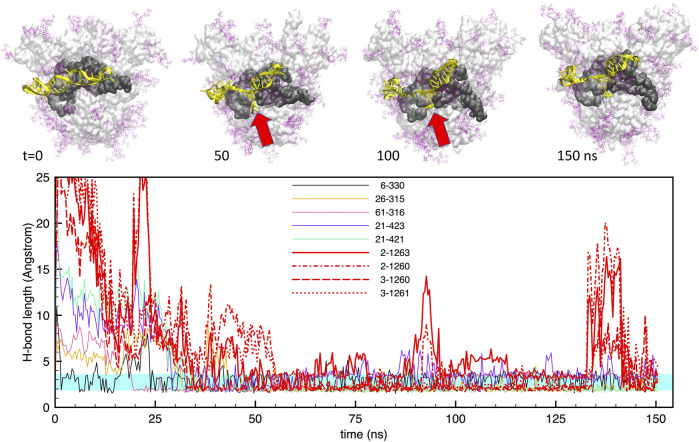
FIGURE 3.
Evolution of the structure and hydrogen bonds formed by the DNA apta1 (51-nt) interacting with the S-protein trimer in the closed conformation. Lower panel. Time plot of the major H-bonds formed by nucleotides (numbers 1–51) and S-protein residues (numbers >300). Thin lines indicate the H-bonds between the aptamer and the RBD of monomer one; the thick red lines indicates the four extra H-bonds with the RBD of monomer 2 (times t ≃50–125 ns. The cyan shaded band indicates the typical interval of H-bond length (2.4–3.6 ). Upper panel. Snapshots of the aptamer-S-protein contact, at times t = 0,50, 100, 150 ns DNA is depicted in yellow; protein surface in light grey, with the RBD of monomer one in dark grey; glycans in purple. The red arrows indicates the site of the extra H-bonds with the RBD of monomer 2. The atomic structures are tilted by about 30deg with respect to the central symmetry axis of the S-protein.

