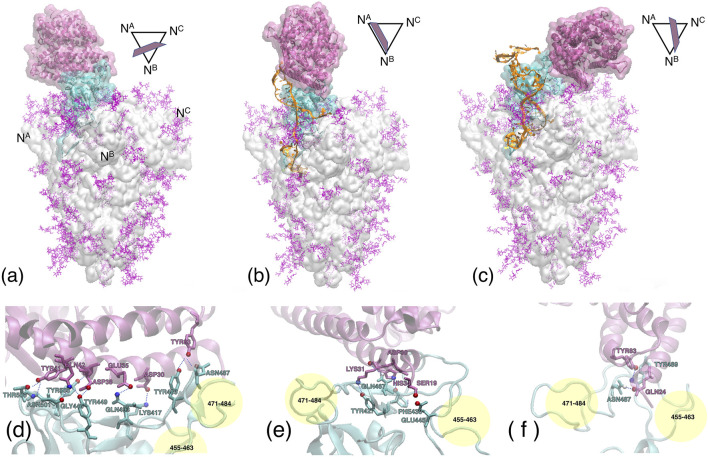
FIGURE 8.
Upper panel Contact regions between the ACE2 receptor (mauve ribbons and transparent surface), the S1 subdomain (cyan ribbons and surface), and the DNA aptamer (orange ribbons). The remaining of the whole S-protein trimer is shown as a light grey transparent surface, with the glycans in purple. (A) Experimental configuration 6M0J after 50 ns MD equilibration. (B) MD simulation with the apta1. (C) MD simulation with the apta2. The central axis of the S-protein trimer is oriented vertically. The symbols above/right of each figure depict the approximate orientation of the α 1-helix of ACE2, with respect to the cross section of the S-protein [the vertices indicate the N-terminals of each protomer, also reported in the panel (a)]. Lower panel Hydrogen bonds formed at the ACE2/RBD interface, for the experimental configuration (D) (only the central region indicated, see Table 1); apta1 (D); and apta2 (F). The yellow spheres approximately indicate the regions of residues 455–463 and 471–484 of the RBD, to provide a relative orientation of the lower figures with respect to the panel above.

