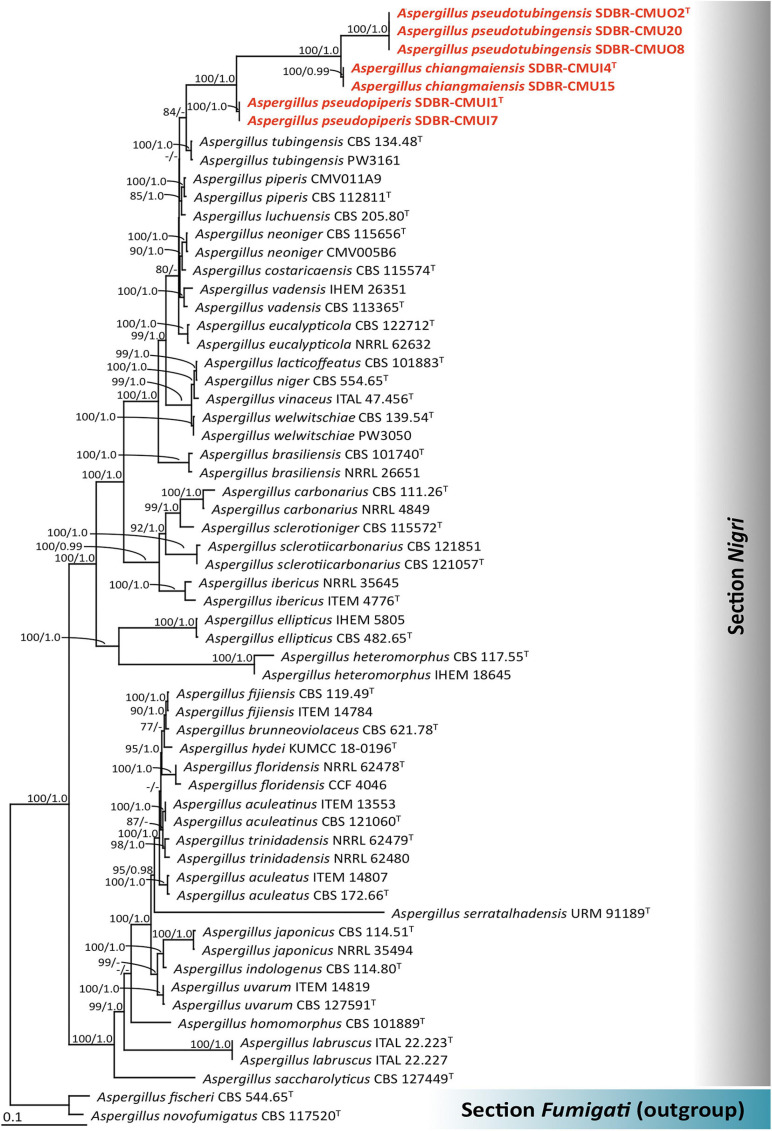
FIGURE 1.
Phylogenetic tree derived from maximum likelihood (ML) analysis of the combined cam, benA, rpb2, tef1, and act genes of 61 sequences. Aspergillus fischeri and Aspergillus novofumigatus were used as outgroup. Numbers above branches are bootstrap (BS) values (left) and posterior probability (PP) values (right). Branches with BS and PP values more than 70% and 0.95, respectively, are shown at each branch. Bar represents 0.1 substitutions per nucleotide position. Hyphen (-) represents support values ≤ 70%/0.95. Superscript “T” indicates the type species. The fungal strains obtained in this study are represented in bold red.

